Brazilian vs Immigrants from Western Asia Male Unemployment
COMPARE
Brazilian
Immigrants from Western Asia
Male Unemployment
Male Unemployment Comparison
Brazilians
Immigrants from Western Asia
5.2%
MALE UNEMPLOYMENT
79.3/ 100
METRIC RATING
140th/ 347
METRIC RANK
5.6%
MALE UNEMPLOYMENT
3.5/ 100
METRIC RATING
219th/ 347
METRIC RANK
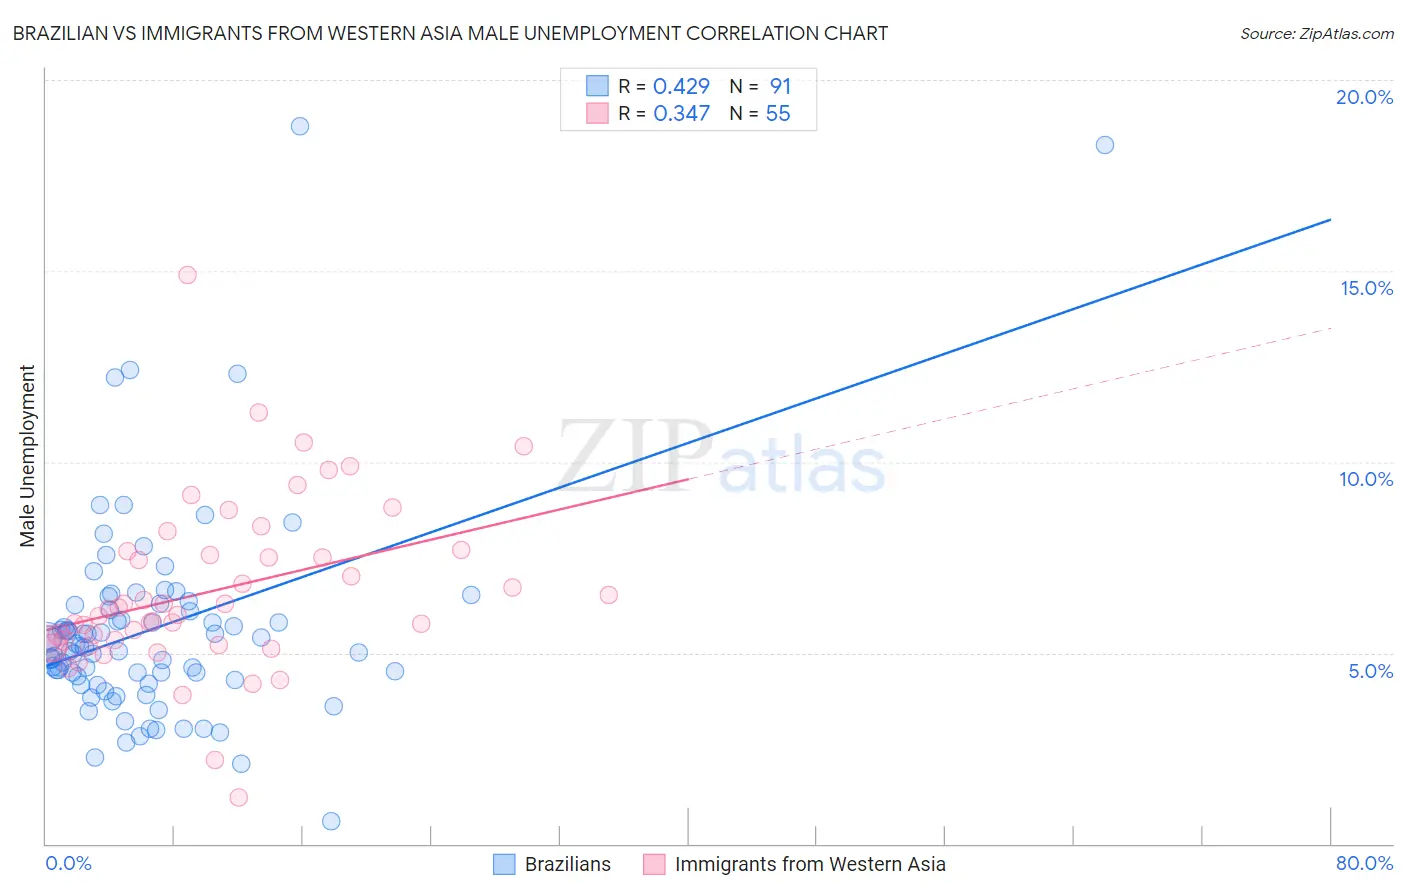
Brazilian vs Immigrants from Western Asia Male Unemployment Correlation Chart
The statistical analysis conducted on geographies consisting of 323,069,083 people shows a moderate positive correlation between the proportion of Brazilians and unemployment rate among males in the United States with a correlation coefficient (R) of 0.429 and weighted average of 5.2%. Similarly, the statistical analysis conducted on geographies consisting of 403,036,222 people shows a mild positive correlation between the proportion of Immigrants from Western Asia and unemployment rate among males in the United States with a correlation coefficient (R) of 0.347 and weighted average of 5.6%, a difference of 6.9%.
Male Unemployment Correlation Summary
| Measurement | Brazilian | Immigrants from Western Asia |
| Minimum | 0.60% | 1.2% |
| Maximum | 18.8% | 14.9% |
| Range | 18.2% | 13.7% |
| Mean | 5.6% | 6.6% |
| Median | 5.2% | 6.1% |
| Interquartile 25% (IQ1) | 4.3% | 5.2% |
| Interquartile 75% (IQ3) | 6.3% | 7.6% |
| Interquartile Range (IQR) | 2.0% | 2.4% |
| Standard Deviation (Sample) | 2.8% | 2.3% |
| Standard Deviation (Population) | 2.8% | 2.3% |
Similar Demographics by Male Unemployment
Demographics Similar to Brazilians by Male Unemployment
In terms of male unemployment, the demographic groups most similar to Brazilians are Kenyan (5.2%, a difference of 0.010%), Immigrants from Switzerland (5.2%, a difference of 0.010%), Immigrants from Croatia (5.2%, a difference of 0.030%), Immigrants from Eastern Africa (5.2%, a difference of 0.040%), and Lebanese (5.2%, a difference of 0.050%).
| Demographics | Rating | Rank | Male Unemployment |
| Colombians | 81.1 /100 | #133 | Excellent 5.2% |
| Pakistanis | 80.5 /100 | #134 | Excellent 5.2% |
| Immigrants | Saudi Arabia | 80.1 /100 | #135 | Excellent 5.2% |
| Lebanese | 79.9 /100 | #136 | Good 5.2% |
| Immigrants | Eastern Africa | 79.8 /100 | #137 | Good 5.2% |
| Immigrants | Croatia | 79.7 /100 | #138 | Good 5.2% |
| Kenyans | 79.4 /100 | #139 | Good 5.2% |
| Brazilians | 79.3 /100 | #140 | Good 5.2% |
| Immigrants | Switzerland | 79.2 /100 | #141 | Good 5.2% |
| Fijians | 78.3 /100 | #142 | Good 5.2% |
| Syrians | 78.0 /100 | #143 | Good 5.2% |
| Sri Lankans | 77.9 /100 | #144 | Good 5.2% |
| Macedonians | 77.7 /100 | #145 | Good 5.2% |
| Immigrants | Kenya | 77.6 /100 | #146 | Good 5.2% |
| Immigrants | Burma/Myanmar | 77.5 /100 | #147 | Good 5.2% |
Demographics Similar to Immigrants from Western Asia by Male Unemployment
In terms of male unemployment, the demographic groups most similar to Immigrants from Western Asia are Portuguese (5.6%, a difference of 0.030%), Immigrants from Albania (5.5%, a difference of 0.050%), Soviet Union (5.6%, a difference of 0.13%), Delaware (5.5%, a difference of 0.25%), and Immigrants from Micronesia (5.6%, a difference of 0.27%).
| Demographics | Rating | Rank | Male Unemployment |
| Hmong | 7.0 /100 | #212 | Tragic 5.5% |
| Ugandans | 6.3 /100 | #213 | Tragic 5.5% |
| Puget Sound Salish | 5.6 /100 | #214 | Tragic 5.5% |
| Samoans | 4.9 /100 | #215 | Tragic 5.5% |
| Immigrants | Immigrants | 4.3 /100 | #216 | Tragic 5.5% |
| Delaware | 4.2 /100 | #217 | Tragic 5.5% |
| Immigrants | Albania | 3.6 /100 | #218 | Tragic 5.5% |
| Immigrants | Western Asia | 3.5 /100 | #219 | Tragic 5.6% |
| Portuguese | 3.5 /100 | #220 | Tragic 5.6% |
| Soviet Union | 3.2 /100 | #221 | Tragic 5.6% |
| Immigrants | Micronesia | 2.9 /100 | #222 | Tragic 5.6% |
| Creek | 2.6 /100 | #223 | Tragic 5.6% |
| Cherokee | 2.4 /100 | #224 | Tragic 5.6% |
| Panamanians | 1.9 /100 | #225 | Tragic 5.6% |
| Immigrants | Cambodia | 1.8 /100 | #226 | Tragic 5.6% |