Yakama vs Nicaraguan In Labor Force | Age 30-34
COMPARE
Yakama
Nicaraguan
In Labor Force | Age 30-34
In Labor Force | Age 30-34 Comparison
Yakama
Nicaraguans
79.1%
IN LABOR FORCE | AGE 30-34
0.0/ 100
METRIC RATING
337th/ 347
METRIC RANK
83.9%
IN LABOR FORCE | AGE 30-34
0.6/ 100
METRIC RATING
251st/ 347
METRIC RANK
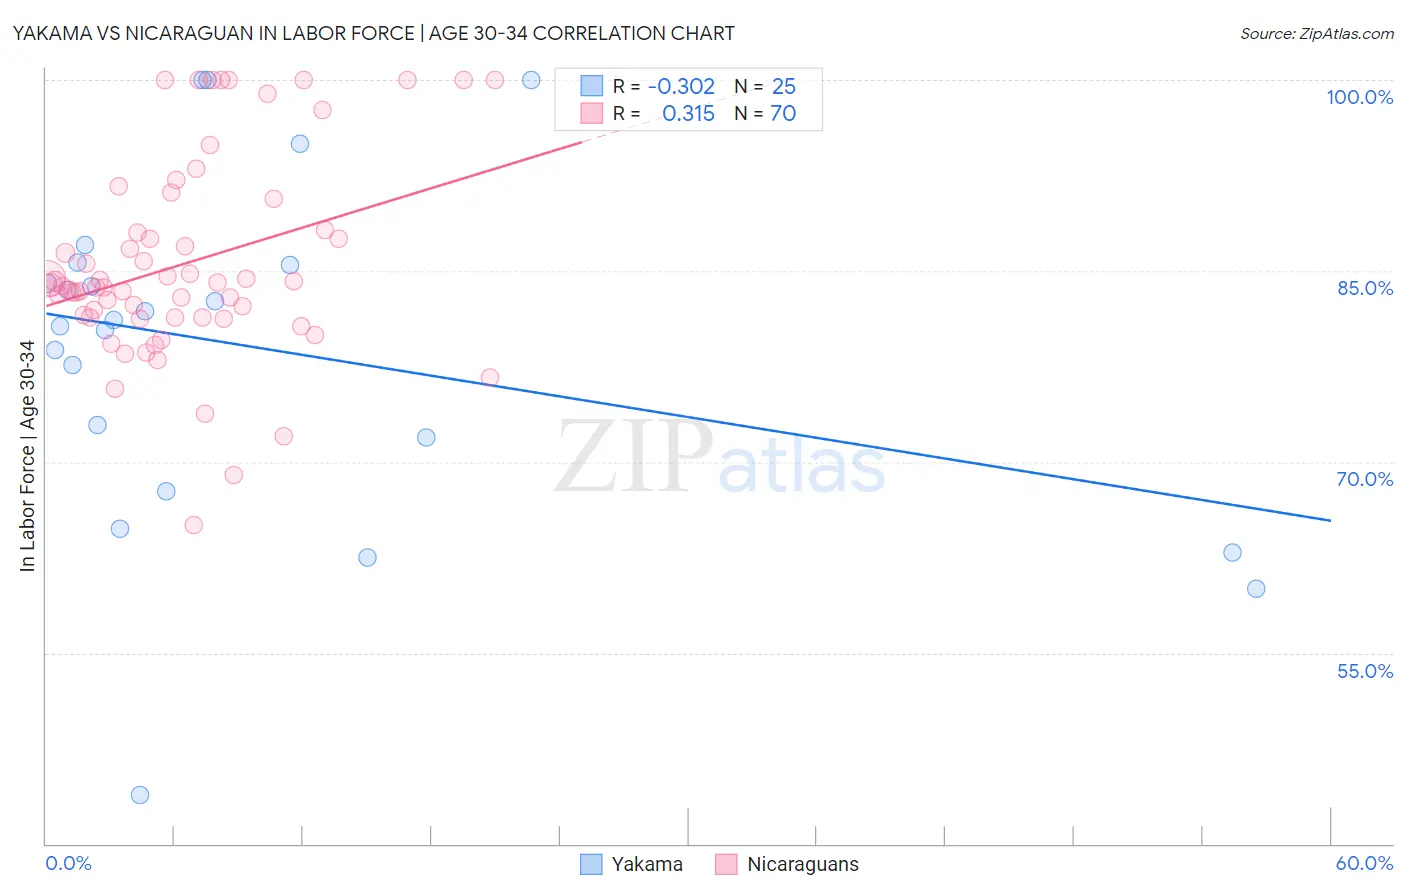
Yakama vs Nicaraguan In Labor Force | Age 30-34 Correlation Chart
The statistical analysis conducted on geographies consisting of 19,914,552 people shows a mild negative correlation between the proportion of Yakama and labor force participation rate among population between the ages 30 and 34 in the United States with a correlation coefficient (R) of -0.302 and weighted average of 79.1%. Similarly, the statistical analysis conducted on geographies consisting of 285,621,495 people shows a mild positive correlation between the proportion of Nicaraguans and labor force participation rate among population between the ages 30 and 34 in the United States with a correlation coefficient (R) of 0.315 and weighted average of 83.9%, a difference of 6.0%.
In Labor Force | Age 30-34 Correlation Summary
| Measurement | Yakama | Nicaraguan |
| Minimum | 43.8% | 65.0% |
| Maximum | 100.0% | 100.0% |
| Range | 56.2% | 35.0% |
| Mean | 79.0% | 85.6% |
| Median | 81.1% | 83.8% |
| Interquartile 25% (IQ1) | 69.8% | 81.3% |
| Interquartile 75% (IQ3) | 85.6% | 88.2% |
| Interquartile Range (IQR) | 15.8% | 6.9% |
| Standard Deviation (Sample) | 13.5% | 7.8% |
| Standard Deviation (Population) | 13.2% | 7.8% |
Similar Demographics by In Labor Force | Age 30-34
Demographics Similar to Yakama by In Labor Force | Age 30-34
In terms of in labor force | age 30-34, the demographic groups most similar to Yakama are Native/Alaskan (79.2%, a difference of 0.040%), Marshallese (79.2%, a difference of 0.12%), Pima (79.0%, a difference of 0.12%), Hopi (79.3%, a difference of 0.15%), and Apache (79.0%, a difference of 0.15%).
| Demographics | Rating | Rank | In Labor Force | Age 30-34 |
| Pueblo | 0.0 /100 | #330 | Tragic 80.0% |
| Houma | 0.0 /100 | #331 | Tragic 79.9% |
| Kiowa | 0.0 /100 | #332 | Tragic 79.8% |
| Inupiat | 0.0 /100 | #333 | Tragic 79.7% |
| Hopi | 0.0 /100 | #334 | Tragic 79.3% |
| Marshallese | 0.0 /100 | #335 | Tragic 79.2% |
| Natives/Alaskans | 0.0 /100 | #336 | Tragic 79.2% |
| Yakama | 0.0 /100 | #337 | Tragic 79.1% |
| Pima | 0.0 /100 | #338 | Tragic 79.0% |
| Apache | 0.0 /100 | #339 | Tragic 79.0% |
| Ute | 0.0 /100 | #340 | Tragic 78.9% |
| Immigrants | Yemen | 0.0 /100 | #341 | Tragic 78.2% |
| Tohono O'odham | 0.0 /100 | #342 | Tragic 77.7% |
| Lumbee | 0.0 /100 | #343 | Tragic 77.3% |
| Yuman | 0.0 /100 | #344 | Tragic 77.1% |
Demographics Similar to Nicaraguans by In Labor Force | Age 30-34
In terms of in labor force | age 30-34, the demographic groups most similar to Nicaraguans are Bahamian (83.9%, a difference of 0.0%), Immigrants from Nicaragua (83.9%, a difference of 0.010%), Immigrants from Iraq (83.9%, a difference of 0.020%), Immigrants from St. Vincent and the Grenadines (83.9%, a difference of 0.030%), and Portuguese (84.0%, a difference of 0.040%).
| Demographics | Rating | Rank | In Labor Force | Age 30-34 |
| Basques | 0.9 /100 | #244 | Tragic 84.0% |
| Immigrants | Venezuela | 0.9 /100 | #245 | Tragic 84.0% |
| Central Americans | 0.9 /100 | #246 | Tragic 84.0% |
| British West Indians | 0.8 /100 | #247 | Tragic 84.0% |
| Portuguese | 0.8 /100 | #248 | Tragic 84.0% |
| Immigrants | Dominica | 0.7 /100 | #249 | Tragic 84.0% |
| Immigrants | Iraq | 0.7 /100 | #250 | Tragic 83.9% |
| Nicaraguans | 0.6 /100 | #251 | Tragic 83.9% |
| Bahamians | 0.6 /100 | #252 | Tragic 83.9% |
| Immigrants | Nicaragua | 0.6 /100 | #253 | Tragic 83.9% |
| Immigrants | St. Vincent and the Grenadines | 0.5 /100 | #254 | Tragic 83.9% |
| Whites/Caucasians | 0.5 /100 | #255 | Tragic 83.9% |
| Immigrants | Lebanon | 0.4 /100 | #256 | Tragic 83.9% |
| Iraqis | 0.3 /100 | #257 | Tragic 83.8% |
| Hondurans | 0.3 /100 | #258 | Tragic 83.8% |