Yakama vs Immigrants from Japan Female Unemployment
COMPARE
Yakama
Immigrants from Japan
Female Unemployment
Female Unemployment Comparison
Yakama
Immigrants from Japan
6.7%
FEMALE UNEMPLOYMENT
0.0/ 100
METRIC RATING
330th/ 347
METRIC RANK
5.0%
FEMALE UNEMPLOYMENT
96.0/ 100
METRIC RATING
91st/ 347
METRIC RANK
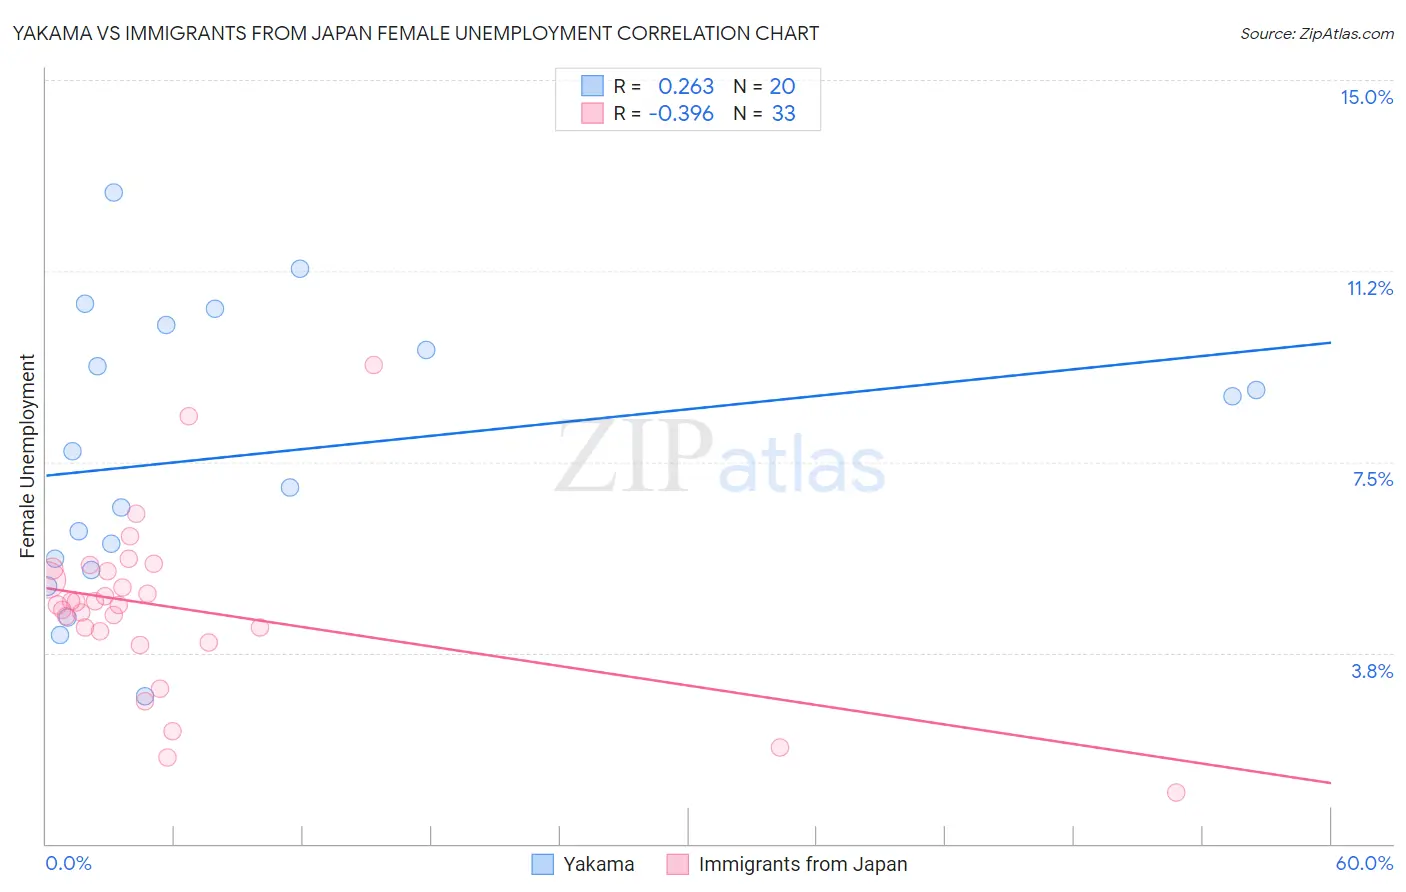
Yakama vs Immigrants from Japan Female Unemployment Correlation Chart
The statistical analysis conducted on geographies consisting of 19,884,840 people shows a weak positive correlation between the proportion of Yakama and unemploymnet rate among females in the United States with a correlation coefficient (R) of 0.263 and weighted average of 6.7%. Similarly, the statistical analysis conducted on geographies consisting of 339,198,436 people shows a mild negative correlation between the proportion of Immigrants from Japan and unemploymnet rate among females in the United States with a correlation coefficient (R) of -0.396 and weighted average of 5.0%, a difference of 34.3%.
Female Unemployment Correlation Summary
| Measurement | Yakama | Immigrants from Japan |
| Minimum | 2.9% | 1.0% |
| Maximum | 12.8% | 9.4% |
| Range | 9.9% | 8.4% |
| Mean | 7.6% | 4.6% |
| Median | 7.4% | 4.7% |
| Interquartile 25% (IQ1) | 5.5% | 4.1% |
| Interquartile 75% (IQ3) | 9.9% | 5.4% |
| Interquartile Range (IQR) | 4.5% | 1.3% |
| Standard Deviation (Sample) | 2.7% | 1.7% |
| Standard Deviation (Population) | 2.7% | 1.6% |
Similar Demographics by Female Unemployment
Demographics Similar to Yakama by Female Unemployment
In terms of female unemployment, the demographic groups most similar to Yakama are Immigrants from Guyana (6.7%, a difference of 0.57%), Guyanese (6.7%, a difference of 0.94%), Paiute (6.8%, a difference of 1.1%), Alaska Native (6.6%, a difference of 1.4%), and Native/Alaskan (6.6%, a difference of 1.5%).
| Demographics | Rating | Rank | Female Unemployment |
| Immigrants | Belize | 0.0 /100 | #323 | Tragic 6.5% |
| Cheyenne | 0.0 /100 | #324 | Tragic 6.6% |
| Apache | 0.0 /100 | #325 | Tragic 6.6% |
| Natives/Alaskans | 0.0 /100 | #326 | Tragic 6.6% |
| Alaska Natives | 0.0 /100 | #327 | Tragic 6.6% |
| Guyanese | 0.0 /100 | #328 | Tragic 6.7% |
| Immigrants | Guyana | 0.0 /100 | #329 | Tragic 6.7% |
| Yakama | 0.0 /100 | #330 | Tragic 6.7% |
| Paiute | 0.0 /100 | #331 | Tragic 6.8% |
| Sioux | 0.0 /100 | #332 | Tragic 7.0% |
| Menominee | 0.0 /100 | #333 | Tragic 7.0% |
| Immigrants | Armenia | 0.0 /100 | #334 | Tragic 7.1% |
| Dominicans | 0.0 /100 | #335 | Tragic 7.2% |
| Immigrants | Dominican Republic | 0.0 /100 | #336 | Tragic 7.2% |
| Navajo | 0.0 /100 | #337 | Tragic 7.3% |
Demographics Similar to Immigrants from Japan by Female Unemployment
In terms of female unemployment, the demographic groups most similar to Immigrants from Japan are Romanian (5.0%, a difference of 0.030%), Immigrants from Austria (5.0%, a difference of 0.10%), Immigrants from Sweden (5.0%, a difference of 0.12%), Immigrants from Malaysia (5.0%, a difference of 0.13%), and Burmese (5.0%, a difference of 0.15%).
| Demographics | Rating | Rank | Female Unemployment |
| Canadians | 97.2 /100 | #84 | Exceptional 5.0% |
| Ukrainians | 97.1 /100 | #85 | Exceptional 5.0% |
| Bolivians | 97.1 /100 | #86 | Exceptional 5.0% |
| Venezuelans | 96.9 /100 | #87 | Exceptional 5.0% |
| Immigrants | Sudan | 96.7 /100 | #88 | Exceptional 5.0% |
| Immigrants | Taiwan | 96.6 /100 | #89 | Exceptional 5.0% |
| Immigrants | Sweden | 96.3 /100 | #90 | Exceptional 5.0% |
| Immigrants | Japan | 96.0 /100 | #91 | Exceptional 5.0% |
| Romanians | 95.9 /100 | #92 | Exceptional 5.0% |
| Immigrants | Austria | 95.7 /100 | #93 | Exceptional 5.0% |
| Immigrants | Malaysia | 95.7 /100 | #94 | Exceptional 5.0% |
| Burmese | 95.6 /100 | #95 | Exceptional 5.0% |
| Immigrants | South Central Asia | 95.5 /100 | #96 | Exceptional 5.0% |
| Immigrants | Somalia | 95.2 /100 | #97 | Exceptional 5.0% |
| Immigrants | Kuwait | 95.2 /100 | #98 | Exceptional 5.0% |