White/Caucasian vs Celtic Unemployment Among Youth under 25 years
COMPARE
White/Caucasian
Celtic
Unemployment Among Youth under 25 years
Unemployment Among Youth under 25 years Comparison
Whites/Caucasians
Celtics
11.2%
UNEMPLOYMENT AMONG YOUTH UNDER 25 YEARS
96.9/ 100
METRIC RATING
77th/ 347
METRIC RANK
11.3%
UNEMPLOYMENT AMONG YOUTH UNDER 25 YEARS
94.0/ 100
METRIC RATING
99th/ 347
METRIC RANK
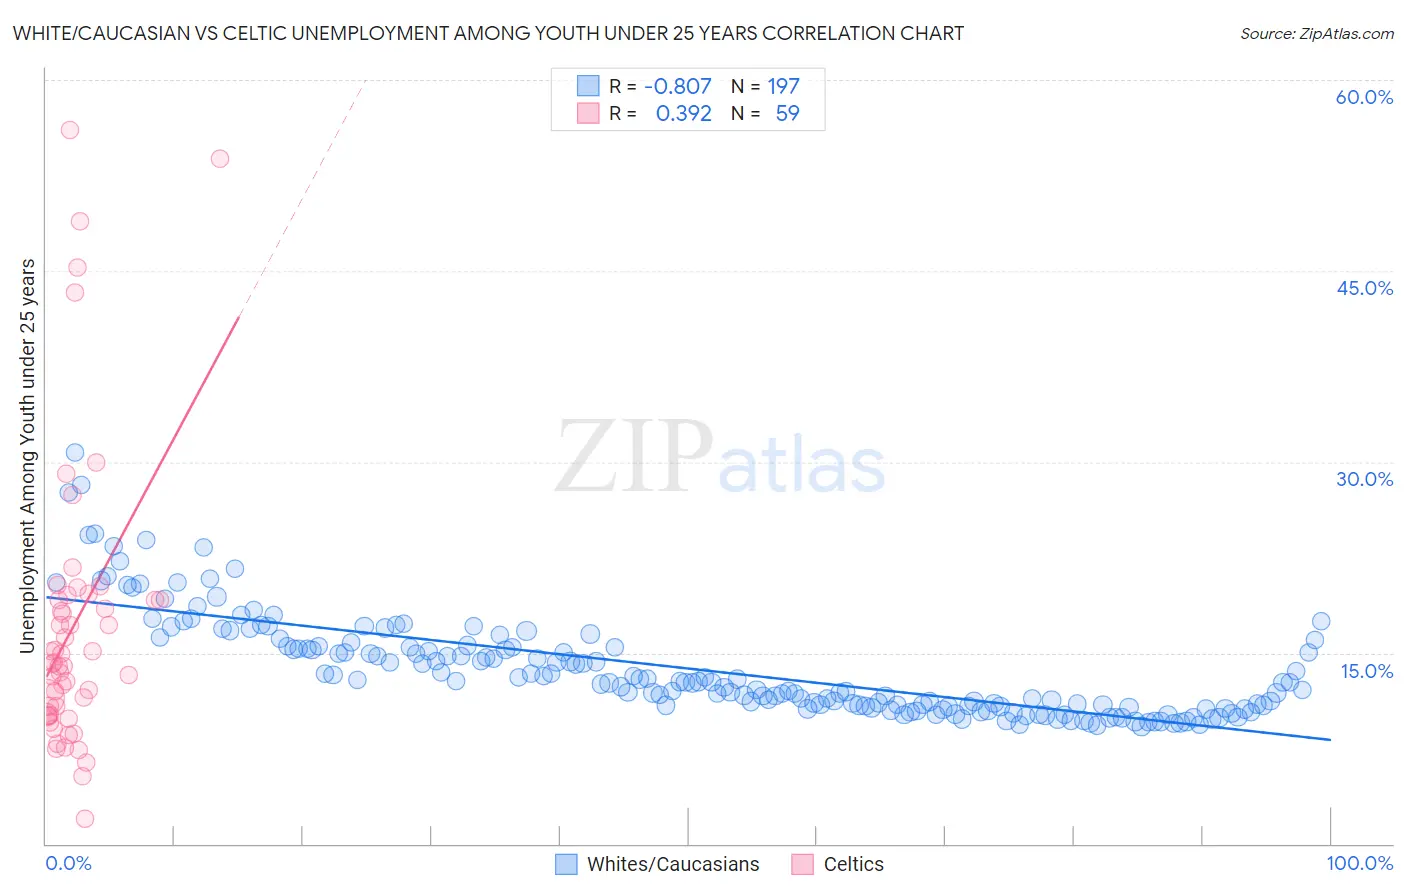
White/Caucasian vs Celtic Unemployment Among Youth under 25 years Correlation Chart
The statistical analysis conducted on geographies consisting of 555,079,229 people shows a very strong negative correlation between the proportion of Whites/Caucasians and unemployment rate among youth under the age of 25 in the United States with a correlation coefficient (R) of -0.807 and weighted average of 11.2%. Similarly, the statistical analysis conducted on geographies consisting of 167,560,054 people shows a mild positive correlation between the proportion of Celtics and unemployment rate among youth under the age of 25 in the United States with a correlation coefficient (R) of 0.392 and weighted average of 11.3%, a difference of 0.74%.
Unemployment Among Youth under 25 years Correlation Summary
| Measurement | White/Caucasian | Celtic |
| Minimum | 9.2% | 2.0% |
| Maximum | 30.8% | 56.1% |
| Range | 21.5% | 54.1% |
| Mean | 13.7% | 17.2% |
| Median | 12.7% | 14.1% |
| Interquartile 25% (IQ1) | 10.8% | 10.1% |
| Interquartile 75% (IQ3) | 15.5% | 19.1% |
| Interquartile Range (IQR) | 4.7% | 9.0% |
| Standard Deviation (Sample) | 4.0% | 11.4% |
| Standard Deviation (Population) | 3.9% | 11.3% |
Similar Demographics by Unemployment Among Youth under 25 years
Demographics Similar to Whites/Caucasians by Unemployment Among Youth under 25 years
In terms of unemployment among youth under 25 years, the demographic groups most similar to Whites/Caucasians are German Russian (11.2%, a difference of 0.050%), Immigrants from Nicaragua (11.2%, a difference of 0.060%), Immigrants from Canada (11.2%, a difference of 0.070%), French (11.2%, a difference of 0.080%), and New Zealander (11.2%, a difference of 0.11%).
| Demographics | Rating | Rank | Unemployment Among Youth under 25 years |
| Slavs | 97.5 /100 | #70 | Exceptional 11.2% |
| Bhutanese | 97.4 /100 | #71 | Exceptional 11.2% |
| Immigrants | Australia | 97.3 /100 | #72 | Exceptional 11.2% |
| Creek | 97.2 /100 | #73 | Exceptional 11.2% |
| New Zealanders | 97.2 /100 | #74 | Exceptional 11.2% |
| French | 97.1 /100 | #75 | Exceptional 11.2% |
| German Russians | 97.0 /100 | #76 | Exceptional 11.2% |
| Whites/Caucasians | 96.9 /100 | #77 | Exceptional 11.2% |
| Immigrants | Nicaragua | 96.7 /100 | #78 | Exceptional 11.2% |
| Immigrants | Canada | 96.7 /100 | #79 | Exceptional 11.2% |
| Immigrants | Bulgaria | 96.4 /100 | #80 | Exceptional 11.2% |
| Icelanders | 96.3 /100 | #81 | Exceptional 11.2% |
| Northern Europeans | 96.2 /100 | #82 | Exceptional 11.2% |
| Bolivians | 96.1 /100 | #83 | Exceptional 11.2% |
| French Canadians | 95.9 /100 | #84 | Exceptional 11.2% |
Demographics Similar to Celtics by Unemployment Among Youth under 25 years
In terms of unemployment among youth under 25 years, the demographic groups most similar to Celtics are Pakistani (11.3%, a difference of 0.0%), Iroquois (11.3%, a difference of 0.030%), Nicaraguan (11.3%, a difference of 0.050%), Estonian (11.3%, a difference of 0.050%), and Immigrants from Serbia (11.3%, a difference of 0.070%).
| Demographics | Rating | Rank | Unemployment Among Youth under 25 years |
| Immigrants | Latvia | 95.1 /100 | #92 | Exceptional 11.2% |
| Immigrants | North America | 95.1 /100 | #93 | Exceptional 11.2% |
| Lithuanians | 94.8 /100 | #94 | Exceptional 11.3% |
| Carpatho Rusyns | 94.4 /100 | #95 | Exceptional 11.3% |
| Immigrants | Serbia | 94.4 /100 | #96 | Exceptional 11.3% |
| Nicaraguans | 94.3 /100 | #97 | Exceptional 11.3% |
| Estonians | 94.2 /100 | #98 | Exceptional 11.3% |
| Celtics | 94.0 /100 | #99 | Exceptional 11.3% |
| Pakistanis | 94.0 /100 | #100 | Exceptional 11.3% |
| Iroquois | 93.8 /100 | #101 | Exceptional 11.3% |
| Immigrants | Thailand | 93.6 /100 | #102 | Exceptional 11.3% |
| Immigrants | Malaysia | 93.6 /100 | #103 | Exceptional 11.3% |
| Immigrants | Afghanistan | 93.4 /100 | #104 | Exceptional 11.3% |
| Immigrants | Jordan | 93.1 /100 | #105 | Exceptional 11.3% |
| Chileans | 93.0 /100 | #106 | Exceptional 11.3% |