White/Caucasian vs French Unemployment Among Youth under 25 years
COMPARE
White/Caucasian
French
Unemployment Among Youth under 25 years
Unemployment Among Youth under 25 years Comparison
Whites/Caucasians
French
11.2%
UNEMPLOYMENT AMONG YOUTH UNDER 25 YEARS
96.9/ 100
METRIC RATING
77th/ 347
METRIC RANK
11.2%
UNEMPLOYMENT AMONG YOUTH UNDER 25 YEARS
97.1/ 100
METRIC RATING
75th/ 347
METRIC RANK
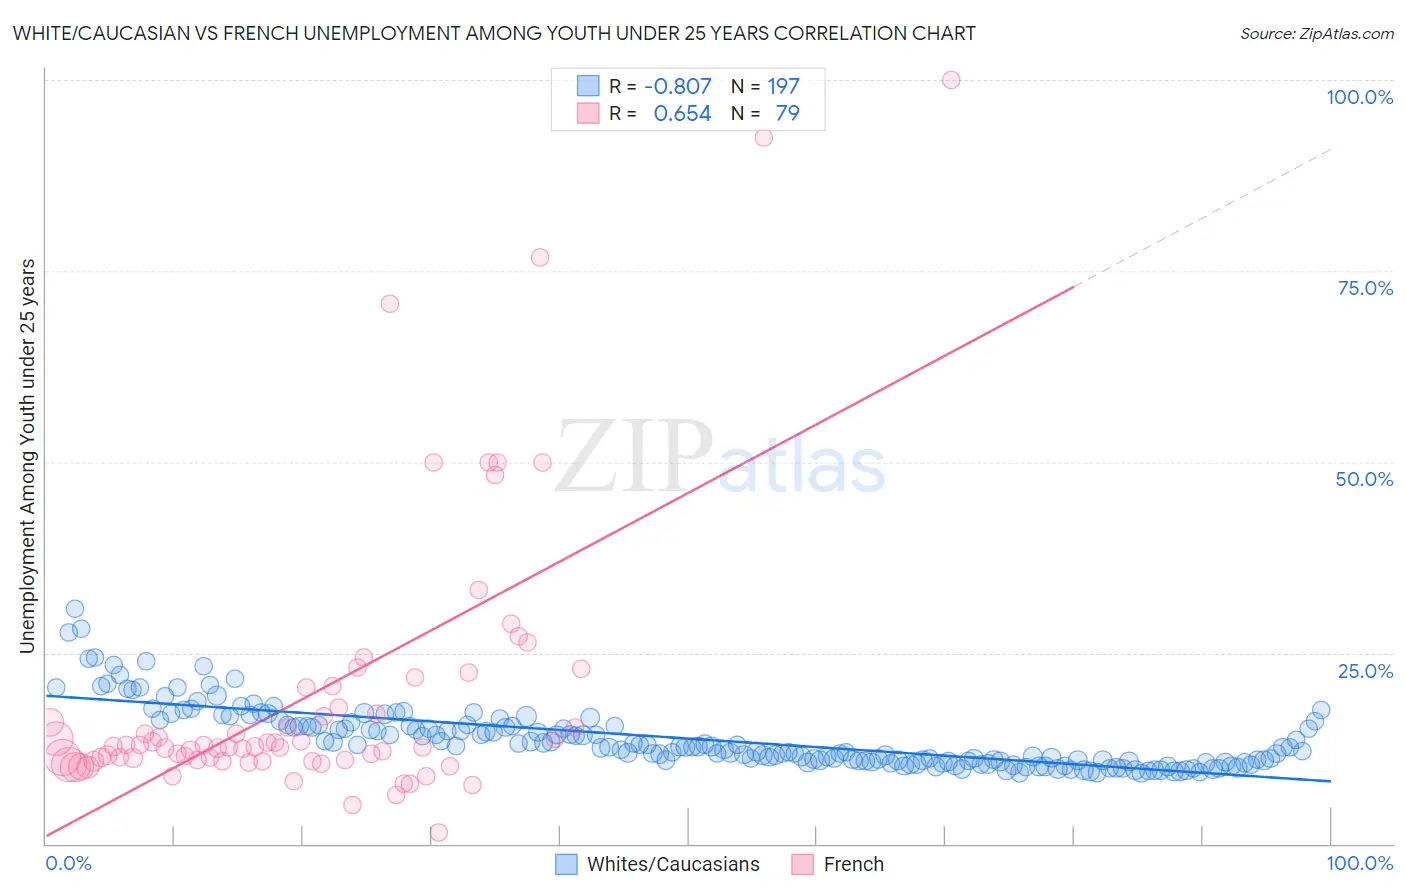
White/Caucasian vs French Unemployment Among Youth under 25 years Correlation Chart
The statistical analysis conducted on geographies consisting of 555,079,229 people shows a very strong negative correlation between the proportion of Whites/Caucasians and unemployment rate among youth under the age of 25 in the United States with a correlation coefficient (R) of -0.807 and weighted average of 11.2%. Similarly, the statistical analysis conducted on geographies consisting of 547,553,137 people shows a significant positive correlation between the proportion of French and unemployment rate among youth under the age of 25 in the United States with a correlation coefficient (R) of 0.654 and weighted average of 11.2%, a difference of 0.080%.
Unemployment Among Youth under 25 years Correlation Summary
| Measurement | White/Caucasian | French |
| Minimum | 9.2% | 1.6% |
| Maximum | 30.8% | 100.0% |
| Range | 21.5% | 98.4% |
| Mean | 13.7% | 19.6% |
| Median | 12.7% | 12.7% |
| Interquartile 25% (IQ1) | 10.8% | 10.9% |
| Interquartile 75% (IQ3) | 15.5% | 20.4% |
| Interquartile Range (IQR) | 4.7% | 9.6% |
| Standard Deviation (Sample) | 4.0% | 18.5% |
| Standard Deviation (Population) | 3.9% | 18.4% |
Demographics Similar to Whites/Caucasians and French by Unemployment Among Youth under 25 years
In terms of unemployment among youth under 25 years, the demographic groups most similar to Whites/Caucasians are German Russian (11.2%, a difference of 0.050%), Immigrants from Nicaragua (11.2%, a difference of 0.060%), Immigrants from Canada (11.2%, a difference of 0.070%), New Zealander (11.2%, a difference of 0.11%), and Creek (11.2%, a difference of 0.12%). Similarly, the demographic groups most similar to French are German Russian (11.2%, a difference of 0.020%), New Zealander (11.2%, a difference of 0.030%), Creek (11.2%, a difference of 0.040%), Immigrants from Australia (11.2%, a difference of 0.090%), and Bhutanese (11.2%, a difference of 0.13%).
| Demographics | Rating | Rank | Unemployment Among Youth under 25 years |
| Macedonians | 97.7 /100 | #66 | Exceptional 11.2% |
| Chickasaw | 97.7 /100 | #67 | Exceptional 11.2% |
| Immigrants | Kenya | 97.6 /100 | #68 | Exceptional 11.2% |
| Immigrants | Moldova | 97.5 /100 | #69 | Exceptional 11.2% |
| Slavs | 97.5 /100 | #70 | Exceptional 11.2% |
| Bhutanese | 97.4 /100 | #71 | Exceptional 11.2% |
| Immigrants | Australia | 97.3 /100 | #72 | Exceptional 11.2% |
| Creek | 97.2 /100 | #73 | Exceptional 11.2% |
| New Zealanders | 97.2 /100 | #74 | Exceptional 11.2% |
| French | 97.1 /100 | #75 | Exceptional 11.2% |
| German Russians | 97.0 /100 | #76 | Exceptional 11.2% |
| Whites/Caucasians | 96.9 /100 | #77 | Exceptional 11.2% |
| Immigrants | Nicaragua | 96.7 /100 | #78 | Exceptional 11.2% |
| Immigrants | Canada | 96.7 /100 | #79 | Exceptional 11.2% |
| Immigrants | Bulgaria | 96.4 /100 | #80 | Exceptional 11.2% |
| Icelanders | 96.3 /100 | #81 | Exceptional 11.2% |
| Northern Europeans | 96.2 /100 | #82 | Exceptional 11.2% |
| Bolivians | 96.1 /100 | #83 | Exceptional 11.2% |
| French Canadians | 95.9 /100 | #84 | Exceptional 11.2% |
| Immigrants | South Central Asia | 95.9 /100 | #85 | Exceptional 11.2% |
| Immigrants | South Africa | 95.8 /100 | #86 | Exceptional 11.2% |