Bangladeshi vs Yup'ik Unemployment Among Youth under 25 years
COMPARE
Bangladeshi
Yup'ik
Unemployment Among Youth under 25 years
Unemployment Among Youth under 25 years Comparison
Bangladeshis
Yup'ik
11.6%
UNEMPLOYMENT AMONG YOUTH UNDER 25 YEARS
55.6/ 100
METRIC RATING
171st/ 347
METRIC RANK
23.7%
UNEMPLOYMENT AMONG YOUTH UNDER 25 YEARS
0.0/ 100
METRIC RATING
347th/ 347
METRIC RANK
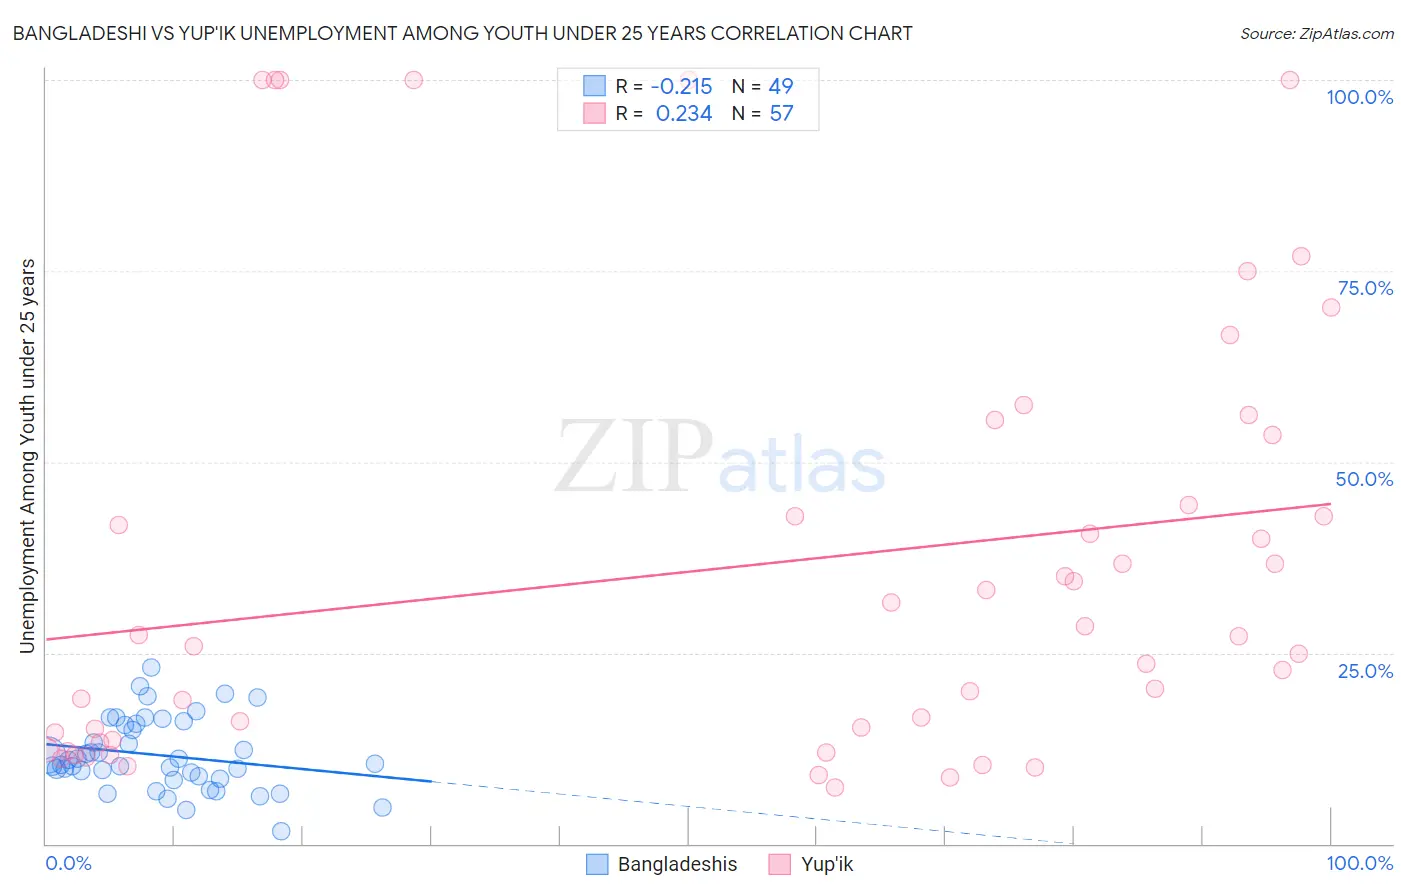
Bangladeshi vs Yup'ik Unemployment Among Youth under 25 years Correlation Chart
The statistical analysis conducted on geographies consisting of 140,831,540 people shows a weak negative correlation between the proportion of Bangladeshis and unemployment rate among youth under the age of 25 in the United States with a correlation coefficient (R) of -0.215 and weighted average of 11.6%. Similarly, the statistical analysis conducted on geographies consisting of 39,847,863 people shows a weak positive correlation between the proportion of Yup'ik and unemployment rate among youth under the age of 25 in the United States with a correlation coefficient (R) of 0.234 and weighted average of 23.7%, a difference of 105.2%.
Unemployment Among Youth under 25 years Correlation Summary
| Measurement | Bangladeshi | Yup'ik |
| Minimum | 1.7% | 7.3% |
| Maximum | 23.1% | 100.0% |
| Range | 21.4% | 92.7% |
| Mean | 11.6% | 36.3% |
| Median | 10.4% | 27.1% |
| Interquartile 25% (IQ1) | 8.7% | 13.4% |
| Interquartile 75% (IQ3) | 15.6% | 49.0% |
| Interquartile Range (IQR) | 6.9% | 35.5% |
| Standard Deviation (Sample) | 4.6% | 28.4% |
| Standard Deviation (Population) | 4.6% | 28.1% |
Similar Demographics by Unemployment Among Youth under 25 years
Demographics Similar to Bangladeshis by Unemployment Among Youth under 25 years
In terms of unemployment among youth under 25 years, the demographic groups most similar to Bangladeshis are Immigrants from Morocco (11.6%, a difference of 0.020%), Russian (11.6%, a difference of 0.070%), Eastern European (11.6%, a difference of 0.080%), Potawatomi (11.6%, a difference of 0.10%), and Okinawan (11.6%, a difference of 0.13%).
| Demographics | Rating | Rank | Unemployment Among Youth under 25 years |
| Immigrants | Laos | 62.4 /100 | #164 | Good 11.5% |
| Immigrants | Sweden | 61.3 /100 | #165 | Good 11.5% |
| Spanish | 60.3 /100 | #166 | Good 11.6% |
| Okinawans | 58.7 /100 | #167 | Average 11.6% |
| Potawatomi | 57.9 /100 | #168 | Average 11.6% |
| Eastern Europeans | 57.5 /100 | #169 | Average 11.6% |
| Russians | 57.3 /100 | #170 | Average 11.6% |
| Bangladeshis | 55.6 /100 | #171 | Average 11.6% |
| Immigrants | Morocco | 55.1 /100 | #172 | Average 11.6% |
| Immigrants | South Eastern Asia | 51.7 /100 | #173 | Average 11.6% |
| Immigrants | China | 50.0 /100 | #174 | Average 11.6% |
| Immigrants | Iraq | 47.0 /100 | #175 | Average 11.6% |
| Ugandans | 45.6 /100 | #176 | Average 11.6% |
| Immigrants | Denmark | 45.0 /100 | #177 | Average 11.6% |
| Immigrants | Europe | 42.4 /100 | #178 | Average 11.6% |
Demographics Similar to Yup'ik by Unemployment Among Youth under 25 years
In terms of unemployment among youth under 25 years, the demographic groups most similar to Yup'ik are Inupiat (22.0%, a difference of 8.0%), Hopi (21.5%, a difference of 10.6%), Crow (20.1%, a difference of 18.4%), Navajo (18.6%, a difference of 27.6%), and Puerto Rican (18.4%, a difference of 29.0%).
| Demographics | Rating | Rank | Unemployment Among Youth under 25 years |
| Guyanese | 0.0 /100 | #333 | Tragic 15.9% |
| Immigrants | Guyana | 0.0 /100 | #334 | Tragic 15.9% |
| Immigrants | St. Vincent and the Grenadines | 0.0 /100 | #335 | Tragic 16.1% |
| Pima | 0.0 /100 | #336 | Tragic 16.2% |
| Arapaho | 0.0 /100 | #337 | Tragic 16.3% |
| Yuman | 0.0 /100 | #338 | Tragic 16.3% |
| Tsimshian | 0.0 /100 | #339 | Tragic 16.5% |
| Colville | 0.0 /100 | #340 | Tragic 16.8% |
| Paiute | 0.0 /100 | #341 | Tragic 17.6% |
| Puerto Ricans | 0.0 /100 | #342 | Tragic 18.4% |
| Navajo | 0.0 /100 | #343 | Tragic 18.6% |
| Crow | 0.0 /100 | #344 | Tragic 20.1% |
| Hopi | 0.0 /100 | #345 | Tragic 21.5% |
| Inupiat | 0.0 /100 | #346 | Tragic 22.0% |
| Yup'ik | 0.0 /100 | #347 | Tragic 23.7% |