White/Caucasian vs Immigrants from Serbia Unemployment Among Youth under 25 years
COMPARE
White/Caucasian
Immigrants from Serbia
Unemployment Among Youth under 25 years
Unemployment Among Youth under 25 years Comparison
Whites/Caucasians
Immigrants from Serbia
11.2%
UNEMPLOYMENT AMONG YOUTH UNDER 25 YEARS
96.9/ 100
METRIC RATING
77th/ 347
METRIC RANK
11.3%
UNEMPLOYMENT AMONG YOUTH UNDER 25 YEARS
94.4/ 100
METRIC RATING
96th/ 347
METRIC RANK
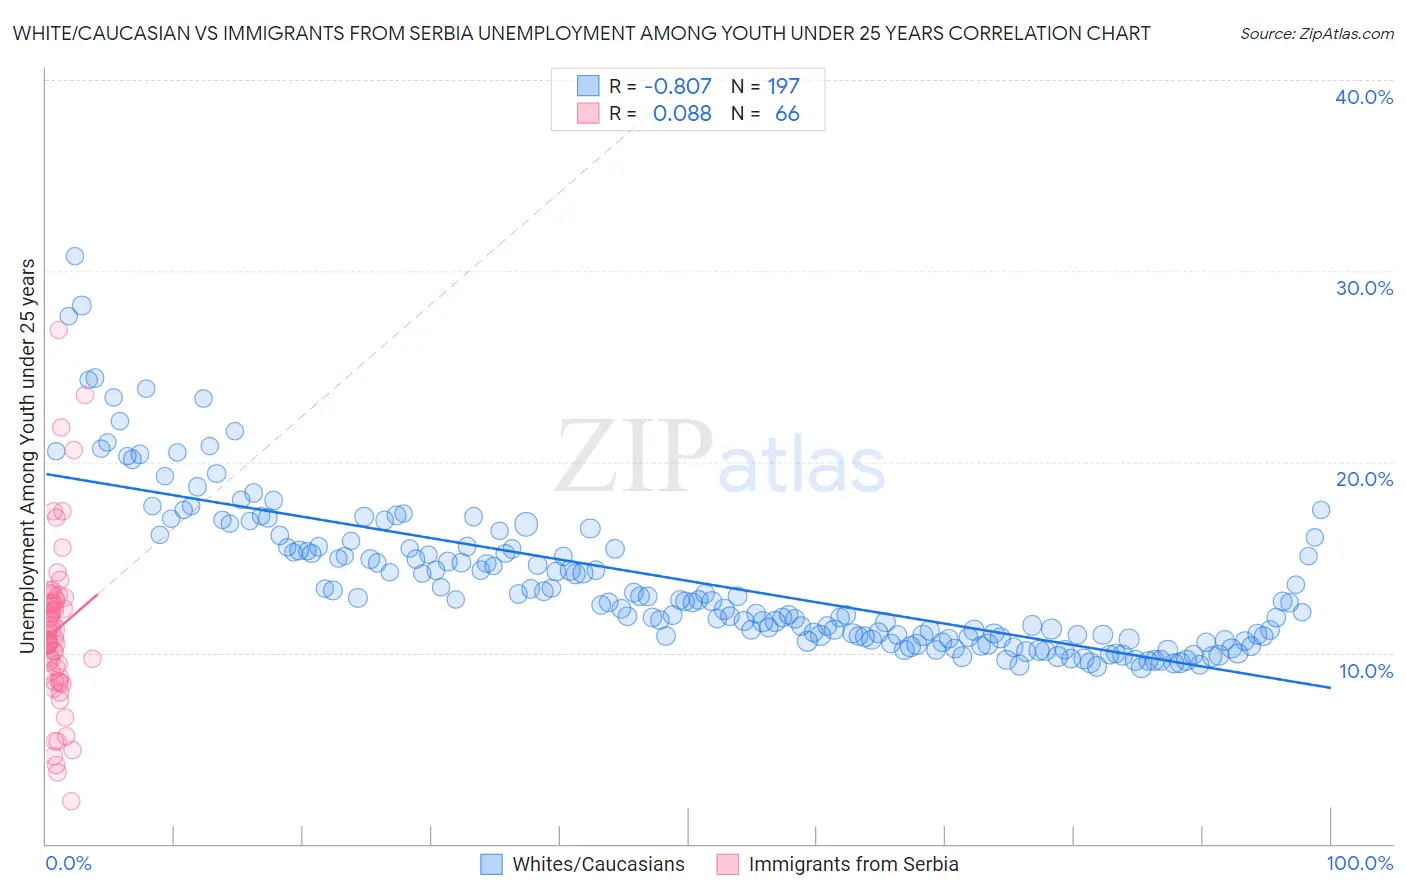
White/Caucasian vs Immigrants from Serbia Unemployment Among Youth under 25 years Correlation Chart
The statistical analysis conducted on geographies consisting of 555,079,229 people shows a very strong negative correlation between the proportion of Whites/Caucasians and unemployment rate among youth under the age of 25 in the United States with a correlation coefficient (R) of -0.807 and weighted average of 11.2%. Similarly, the statistical analysis conducted on geographies consisting of 131,220,496 people shows a slight positive correlation between the proportion of Immigrants from Serbia and unemployment rate among youth under the age of 25 in the United States with a correlation coefficient (R) of 0.088 and weighted average of 11.3%, a difference of 0.66%.
Unemployment Among Youth under 25 years Correlation Summary
| Measurement | White/Caucasian | Immigrants from Serbia |
| Minimum | 9.2% | 2.2% |
| Maximum | 30.8% | 26.9% |
| Range | 21.5% | 24.7% |
| Mean | 13.7% | 11.2% |
| Median | 12.7% | 10.8% |
| Interquartile 25% (IQ1) | 10.8% | 8.7% |
| Interquartile 75% (IQ3) | 15.5% | 12.7% |
| Interquartile Range (IQR) | 4.7% | 3.9% |
| Standard Deviation (Sample) | 4.0% | 4.4% |
| Standard Deviation (Population) | 3.9% | 4.4% |
Demographics Similar to Whites/Caucasians and Immigrants from Serbia by Unemployment Among Youth under 25 years
In terms of unemployment among youth under 25 years, the demographic groups most similar to Whites/Caucasians are German Russian (11.2%, a difference of 0.050%), Immigrants from Nicaragua (11.2%, a difference of 0.060%), Immigrants from Canada (11.2%, a difference of 0.070%), Immigrants from Bulgaria (11.2%, a difference of 0.15%), and Icelander (11.2%, a difference of 0.20%). Similarly, the demographic groups most similar to Immigrants from Serbia are Carpatho Rusyn (11.3%, a difference of 0.010%), Lithuanian (11.3%, a difference of 0.090%), Immigrants from Taiwan (11.2%, a difference of 0.16%), Immigrants from Latvia (11.2%, a difference of 0.16%), and Immigrants from North America (11.2%, a difference of 0.16%).
| Demographics | Rating | Rank | Unemployment Among Youth under 25 years |
| German Russians | 97.0 /100 | #76 | Exceptional 11.2% |
| Whites/Caucasians | 96.9 /100 | #77 | Exceptional 11.2% |
| Immigrants | Nicaragua | 96.7 /100 | #78 | Exceptional 11.2% |
| Immigrants | Canada | 96.7 /100 | #79 | Exceptional 11.2% |
| Immigrants | Bulgaria | 96.4 /100 | #80 | Exceptional 11.2% |
| Icelanders | 96.3 /100 | #81 | Exceptional 11.2% |
| Northern Europeans | 96.2 /100 | #82 | Exceptional 11.2% |
| Bolivians | 96.1 /100 | #83 | Exceptional 11.2% |
| French Canadians | 95.9 /100 | #84 | Exceptional 11.2% |
| Immigrants | South Central Asia | 95.9 /100 | #85 | Exceptional 11.2% |
| Immigrants | South Africa | 95.8 /100 | #86 | Exceptional 11.2% |
| Kenyans | 95.7 /100 | #87 | Exceptional 11.2% |
| Austrians | 95.5 /100 | #88 | Exceptional 11.2% |
| Immigrants | Japan | 95.5 /100 | #89 | Exceptional 11.2% |
| Immigrants | Bolivia | 95.5 /100 | #90 | Exceptional 11.2% |
| Immigrants | Taiwan | 95.1 /100 | #91 | Exceptional 11.2% |
| Immigrants | Latvia | 95.1 /100 | #92 | Exceptional 11.2% |
| Immigrants | North America | 95.1 /100 | #93 | Exceptional 11.2% |
| Lithuanians | 94.8 /100 | #94 | Exceptional 11.3% |
| Carpatho Rusyns | 94.4 /100 | #95 | Exceptional 11.3% |
| Immigrants | Serbia | 94.4 /100 | #96 | Exceptional 11.3% |