Immigrants from Belize vs Tlingit-Haida Unemployment Among Ages 60 to 64 years
COMPARE
Immigrants from Belize
Tlingit-Haida
Unemployment Among Ages 60 to 64 years
Unemployment Among Ages 60 to 64 years Comparison
Immigrants from Belize
Tlingit-Haida
5.7%
UNEMPLOYMENT AMONG AGES 60 TO 64 YEARS
0.0/ 100
METRIC RATING
319th/ 347
METRIC RANK
6.4%
UNEMPLOYMENT AMONG AGES 60 TO 64 YEARS
0.0/ 100
METRIC RATING
339th/ 347
METRIC RANK
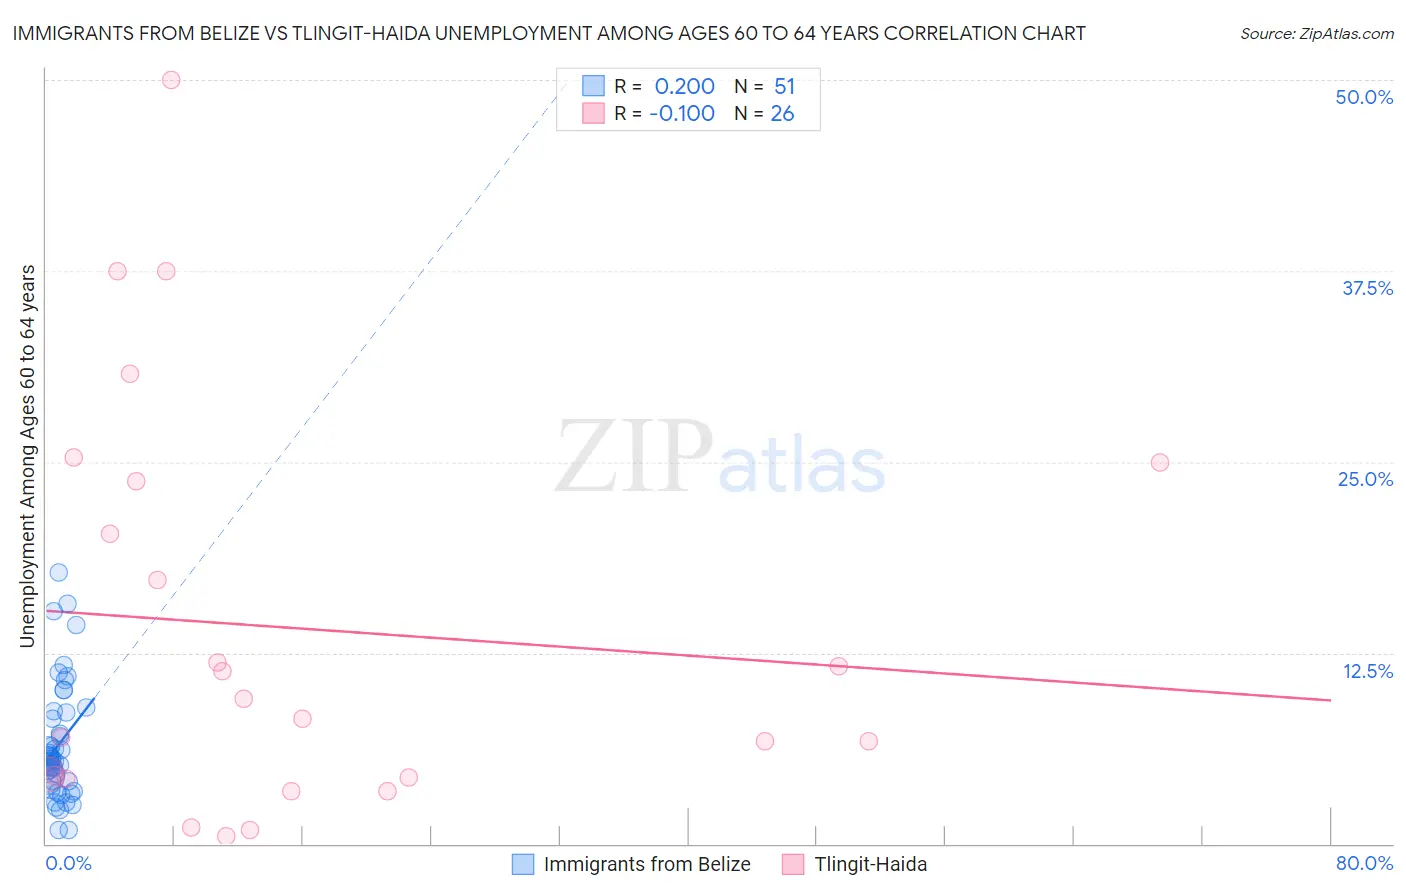
Immigrants from Belize vs Tlingit-Haida Unemployment Among Ages 60 to 64 years Correlation Chart
The statistical analysis conducted on geographies consisting of 126,159,740 people shows a weak positive correlation between the proportion of Immigrants from Belize and unemployment rate among population between the ages 60 and 64 in the United States with a correlation coefficient (R) of 0.200 and weighted average of 5.7%. Similarly, the statistical analysis conducted on geographies consisting of 58,290,195 people shows a slight negative correlation between the proportion of Tlingit-Haida and unemployment rate among population between the ages 60 and 64 in the United States with a correlation coefficient (R) of -0.100 and weighted average of 6.4%, a difference of 12.3%.
Unemployment Among Ages 60 to 64 years Correlation Summary
| Measurement | Immigrants from Belize | Tlingit-Haida |
| Minimum | 0.90% | 0.50% |
| Maximum | 17.8% | 50.0% |
| Range | 16.9% | 49.5% |
| Mean | 6.5% | 14.1% |
| Median | 5.4% | 8.8% |
| Interquartile 25% (IQ1) | 4.1% | 4.3% |
| Interquartile 75% (IQ3) | 8.6% | 23.7% |
| Interquartile Range (IQR) | 4.5% | 19.4% |
| Standard Deviation (Sample) | 3.8% | 13.3% |
| Standard Deviation (Population) | 3.7% | 13.0% |
Demographics Similar to Immigrants from Belize and Tlingit-Haida by Unemployment Among Ages 60 to 64 years
In terms of unemployment among ages 60 to 64 years, the demographic groups most similar to Immigrants from Belize are Colville (5.7%, a difference of 0.77%), Dutch West Indian (5.7%, a difference of 0.82%), Ecuadorian (5.8%, a difference of 1.2%), Alsatian (5.8%, a difference of 1.8%), and Immigrants from Ecuador (5.8%, a difference of 2.2%). Similarly, the demographic groups most similar to Tlingit-Haida are Arapaho (6.3%, a difference of 1.4%), Navajo (6.3%, a difference of 1.9%), Kiowa (6.2%, a difference of 3.0%), Vietnamese (6.1%, a difference of 5.0%), and Puerto Rican (6.1%, a difference of 5.2%).
| Demographics | Rating | Rank | Unemployment Among Ages 60 to 64 years |
| Immigrants | Belize | 0.0 /100 | #319 | Tragic 5.7% |
| Colville | 0.0 /100 | #320 | Tragic 5.7% |
| Dutch West Indians | 0.0 /100 | #321 | Tragic 5.7% |
| Ecuadorians | 0.0 /100 | #322 | Tragic 5.8% |
| Alsatians | 0.0 /100 | #323 | Tragic 5.8% |
| Immigrants | Ecuador | 0.0 /100 | #324 | Tragic 5.8% |
| Paiute | 0.0 /100 | #325 | Tragic 5.8% |
| Immigrants | St. Vincent and the Grenadines | 0.0 /100 | #326 | Tragic 5.9% |
| Immigrants | Grenada | 0.0 /100 | #327 | Tragic 5.9% |
| Apache | 0.0 /100 | #328 | Tragic 6.0% |
| Immigrants | Bangladesh | 0.0 /100 | #329 | Tragic 6.0% |
| Immigrants | Armenia | 0.0 /100 | #330 | Tragic 6.0% |
| Yakama | 0.0 /100 | #331 | Tragic 6.0% |
| Dominicans | 0.0 /100 | #332 | Tragic 6.0% |
| Immigrants | Dominican Republic | 0.0 /100 | #333 | Tragic 6.0% |
| Puerto Ricans | 0.0 /100 | #334 | Tragic 6.1% |
| Vietnamese | 0.0 /100 | #335 | Tragic 6.1% |
| Kiowa | 0.0 /100 | #336 | Tragic 6.2% |
| Navajo | 0.0 /100 | #337 | Tragic 6.3% |
| Arapaho | 0.0 /100 | #338 | Tragic 6.3% |
| Tlingit-Haida | 0.0 /100 | #339 | Tragic 6.4% |