White/Caucasian vs Immigrants from Uganda Unemployment Among Ages 60 to 64 years
COMPARE
White/Caucasian
Immigrants from Uganda
Unemployment Among Ages 60 to 64 years
Unemployment Among Ages 60 to 64 years Comparison
Whites/Caucasians
Immigrants from Uganda
4.7%
UNEMPLOYMENT AMONG AGES 60 TO 64 YEARS
97.8/ 100
METRIC RATING
103rd/ 347
METRIC RANK
4.7%
UNEMPLOYMENT AMONG AGES 60 TO 64 YEARS
98.4/ 100
METRIC RATING
91st/ 347
METRIC RANK
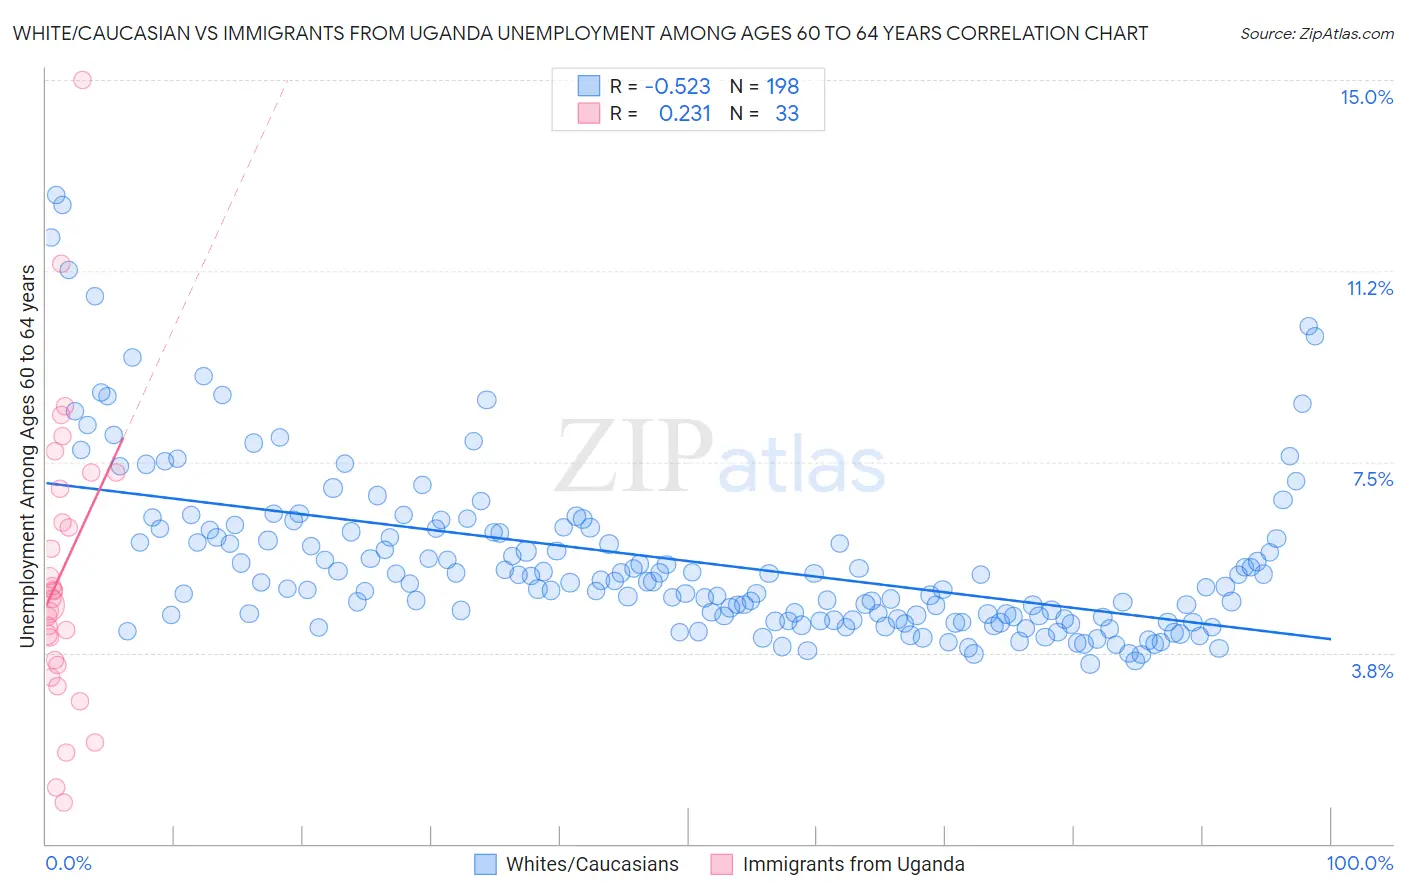
White/Caucasian vs Immigrants from Uganda Unemployment Among Ages 60 to 64 years Correlation Chart
The statistical analysis conducted on geographies consisting of 469,979,801 people shows a substantial negative correlation between the proportion of Whites/Caucasians and unemployment rate among population between the ages 60 and 64 in the United States with a correlation coefficient (R) of -0.523 and weighted average of 4.7%. Similarly, the statistical analysis conducted on geographies consisting of 122,060,042 people shows a weak positive correlation between the proportion of Immigrants from Uganda and unemployment rate among population between the ages 60 and 64 in the United States with a correlation coefficient (R) of 0.231 and weighted average of 4.7%, a difference of 0.30%.
Unemployment Among Ages 60 to 64 years Correlation Summary
| Measurement | White/Caucasian | Immigrants from Uganda |
| Minimum | 3.5% | 0.80% |
| Maximum | 12.7% | 15.0% |
| Range | 9.2% | 14.2% |
| Mean | 5.6% | 5.3% |
| Median | 5.1% | 4.8% |
| Interquartile 25% (IQ1) | 4.4% | 3.6% |
| Interquartile 75% (IQ3) | 6.1% | 7.1% |
| Interquartile Range (IQR) | 1.7% | 3.6% |
| Standard Deviation (Sample) | 1.7% | 2.9% |
| Standard Deviation (Population) | 1.7% | 2.8% |
Demographics Similar to Whites/Caucasians and Immigrants from Uganda by Unemployment Among Ages 60 to 64 years
In terms of unemployment among ages 60 to 64 years, the demographic groups most similar to Whites/Caucasians are Immigrants from Canada (4.7%, a difference of 0.010%), Malaysian (4.7%, a difference of 0.020%), Portuguese (4.7%, a difference of 0.030%), Paraguayan (4.7%, a difference of 0.040%), and Egyptian (4.7%, a difference of 0.060%). Similarly, the demographic groups most similar to Immigrants from Uganda are Romanian (4.7%, a difference of 0.030%), Immigrants from Saudi Arabia (4.7%, a difference of 0.050%), Immigrants from Kuwait (4.7%, a difference of 0.060%), Serbian (4.7%, a difference of 0.14%), and Polish (4.7%, a difference of 0.15%).
| Demographics | Rating | Rank | Unemployment Among Ages 60 to 64 years |
| Immigrants | Jordan | 98.8 /100 | #87 | Exceptional 4.7% |
| Immigrants | Bulgaria | 98.7 /100 | #88 | Exceptional 4.7% |
| Immigrants | Northern Africa | 98.7 /100 | #89 | Exceptional 4.7% |
| Immigrants | Liberia | 98.7 /100 | #90 | Exceptional 4.7% |
| Immigrants | Uganda | 98.4 /100 | #91 | Exceptional 4.7% |
| Romanians | 98.4 /100 | #92 | Exceptional 4.7% |
| Immigrants | Saudi Arabia | 98.3 /100 | #93 | Exceptional 4.7% |
| Immigrants | Kuwait | 98.3 /100 | #94 | Exceptional 4.7% |
| Serbians | 98.2 /100 | #95 | Exceptional 4.7% |
| Poles | 98.1 /100 | #96 | Exceptional 4.7% |
| Immigrants | Albania | 98.0 /100 | #97 | Exceptional 4.7% |
| Somalis | 98.0 /100 | #98 | Exceptional 4.7% |
| Egyptians | 98.0 /100 | #99 | Exceptional 4.7% |
| Portuguese | 97.9 /100 | #100 | Exceptional 4.7% |
| Malaysians | 97.9 /100 | #101 | Exceptional 4.7% |
| Immigrants | Canada | 97.8 /100 | #102 | Exceptional 4.7% |
| Whites/Caucasians | 97.8 /100 | #103 | Exceptional 4.7% |
| Paraguayans | 97.7 /100 | #104 | Exceptional 4.7% |
| Canadians | 97.7 /100 | #105 | Exceptional 4.7% |
| Immigrants | North America | 97.6 /100 | #106 | Exceptional 4.7% |
| Greeks | 97.5 /100 | #107 | Exceptional 4.7% |