Immigrants from Latvia vs Macedonian Unemployment Among Ages 60 to 64 years
COMPARE
Immigrants from Latvia
Macedonian
Unemployment Among Ages 60 to 64 years
Unemployment Among Ages 60 to 64 years Comparison
Immigrants from Latvia
Macedonians
4.9%
UNEMPLOYMENT AMONG AGES 60 TO 64 YEARS
46.9/ 100
METRIC RATING
175th/ 347
METRIC RANK
4.7%
UNEMPLOYMENT AMONG AGES 60 TO 64 YEARS
95.7/ 100
METRIC RATING
120th/ 347
METRIC RANK
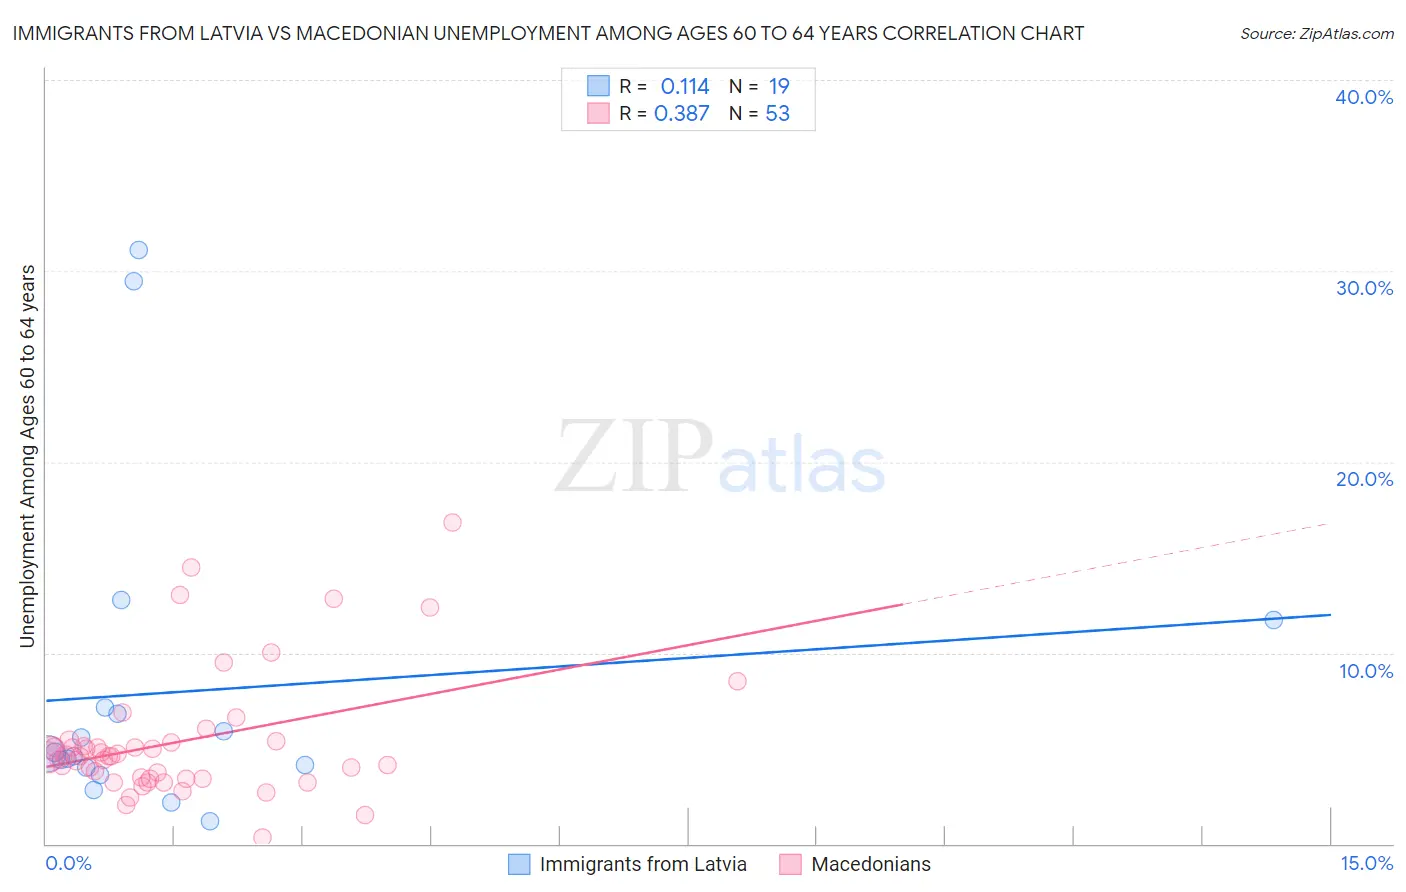
Immigrants from Latvia vs Macedonian Unemployment Among Ages 60 to 64 years Correlation Chart
The statistical analysis conducted on geographies consisting of 110,048,532 people shows a poor positive correlation between the proportion of Immigrants from Latvia and unemployment rate among population between the ages 60 and 64 in the United States with a correlation coefficient (R) of 0.114 and weighted average of 4.9%. Similarly, the statistical analysis conducted on geographies consisting of 126,462,192 people shows a mild positive correlation between the proportion of Macedonians and unemployment rate among population between the ages 60 and 64 in the United States with a correlation coefficient (R) of 0.387 and weighted average of 4.7%, a difference of 2.9%.
Unemployment Among Ages 60 to 64 years Correlation Summary
| Measurement | Immigrants from Latvia | Macedonian |
| Minimum | 1.2% | 0.30% |
| Maximum | 31.1% | 16.8% |
| Range | 29.9% | 16.5% |
| Mean | 8.0% | 5.4% |
| Median | 4.7% | 4.6% |
| Interquartile 25% (IQ1) | 4.0% | 3.4% |
| Interquartile 75% (IQ3) | 7.1% | 5.3% |
| Interquartile Range (IQR) | 3.1% | 1.9% |
| Standard Deviation (Sample) | 8.4% | 3.3% |
| Standard Deviation (Population) | 8.1% | 3.3% |
Similar Demographics by Unemployment Among Ages 60 to 64 years
Demographics Similar to Immigrants from Latvia by Unemployment Among Ages 60 to 64 years
In terms of unemployment among ages 60 to 64 years, the demographic groups most similar to Immigrants from Latvia are Bermudan (4.9%, a difference of 0.010%), Immigrants from Malaysia (4.9%, a difference of 0.080%), Nonimmigrants (4.9%, a difference of 0.080%), Immigrants from Sweden (4.9%, a difference of 0.090%), and Immigrants from Western Europe (4.9%, a difference of 0.11%).
| Demographics | Rating | Rank | Unemployment Among Ages 60 to 64 years |
| Immigrants | Southern Europe | 56.7 /100 | #168 | Average 4.8% |
| Immigrants | France | 55.5 /100 | #169 | Average 4.8% |
| Immigrants | Korea | 54.2 /100 | #170 | Average 4.8% |
| Samoans | 53.6 /100 | #171 | Average 4.9% |
| Immigrants | Turkey | 52.8 /100 | #172 | Average 4.9% |
| Immigrants | Hungary | 50.2 /100 | #173 | Average 4.9% |
| Immigrants | Western Europe | 50.0 /100 | #174 | Average 4.9% |
| Immigrants | Latvia | 46.9 /100 | #175 | Average 4.9% |
| Bermudans | 46.5 /100 | #176 | Average 4.9% |
| Immigrants | Malaysia | 44.7 /100 | #177 | Average 4.9% |
| Immigrants | Nonimmigrants | 44.5 /100 | #178 | Average 4.9% |
| Immigrants | Sweden | 44.3 /100 | #179 | Average 4.9% |
| Asians | 40.8 /100 | #180 | Average 4.9% |
| Hungarians | 40.6 /100 | #181 | Average 4.9% |
| Sri Lankans | 39.8 /100 | #182 | Fair 4.9% |
Demographics Similar to Macedonians by Unemployment Among Ages 60 to 64 years
In terms of unemployment among ages 60 to 64 years, the demographic groups most similar to Macedonians are Immigrants from Morocco (4.7%, a difference of 0.010%), Albanian (4.7%, a difference of 0.080%), Ukrainian (4.7%, a difference of 0.10%), Immigrants from Kazakhstan (4.7%, a difference of 0.11%), and Immigrants from England (4.7%, a difference of 0.15%).
| Demographics | Rating | Rank | Unemployment Among Ages 60 to 64 years |
| Bulgarians | 96.6 /100 | #113 | Exceptional 4.7% |
| Maltese | 96.5 /100 | #114 | Exceptional 4.7% |
| Immigrants | Romania | 96.4 /100 | #115 | Exceptional 4.7% |
| Immigrants | England | 96.3 /100 | #116 | Exceptional 4.7% |
| Immigrants | Germany | 96.3 /100 | #117 | Exceptional 4.7% |
| Ukrainians | 96.1 /100 | #118 | Exceptional 4.7% |
| Immigrants | Morocco | 95.7 /100 | #119 | Exceptional 4.7% |
| Macedonians | 95.7 /100 | #120 | Exceptional 4.7% |
| Albanians | 95.3 /100 | #121 | Exceptional 4.7% |
| Immigrants | Kazakhstan | 95.1 /100 | #122 | Exceptional 4.7% |
| Finns | 94.7 /100 | #123 | Exceptional 4.7% |
| Immigrants | Senegal | 94.5 /100 | #124 | Exceptional 4.7% |
| Immigrants | Thailand | 93.7 /100 | #125 | Exceptional 4.7% |
| Immigrants | South Central Asia | 93.0 /100 | #126 | Exceptional 4.7% |
| Austrians | 91.9 /100 | #127 | Exceptional 4.8% |