Bahamian vs Immigrants from Serbia Unemployment Among Youth under 25 years

COMPARE

Bahamian
Race
Ancestry
AfghanAfricanAlaska NativeAlaskan AthabascanAlbanianAleutAlsatianAmericanApacheArabArapahoArgentineanArmenianAssyrian/Chaldean/SyriacAustralianAustrianBahamianBangladeshiBarbadianBasqueBelgianBelizeanBermudanBhutaneseBlackfeetBolivianBrazilianBritishBritish West IndianBulgarianBurmeseCajunCambodianCanadianCape VerdeanCarpatho RusynCelticCentral AmericanCentral American IndianCherokeeCheyenneChickasawChileanChineseChippewaChoctawColombianColvilleComancheCosta RicanCreeCreekCroatianCrowCubanCypriotCzechCzechoslovakianDanishDelawareDominicanDutchDutch West IndianEastern EuropeanEcuadorianEgyptianEnglishEstonianEthiopianEuropeanFijianFilipinoFinnishFrenchFrench American IndianFrench CanadianGermanGerman RussianGhanaianGreekGuamanian/ChamorroGuatemalanGuyaneseHaitianHmongHonduranHopiHoumaHungarianIcelanderIndian (Asian)IndonesianInupiatIranianIraqiIrishIroquoisIsraeliItalianJamaicanJapaneseJordanianKenyanKiowaKoreanLaotianLatvianLebaneseLiberianLithuanianLumbeeLuxembourgerMacedonianMalaysianMalteseMarshalleseMenomineeMexicanMexican American IndianMongolianMoroccanNative HawaiianNavajoNepaleseNew ZealanderNicaraguanNigerianNorthern EuropeanNorwegianOkinawanOsageOttawaPaiutePakistaniPalestinianPanamanianParaguayanPennsylvania GermanPeruvianPimaPolishPortuguesePotawatomiPuebloPuerto RicanPuget Sound SalishRomanianRussianSalvadoranSamoanScandinavianScotch-IrishScottishSeminoleSenegaleseSerbianShoshoneSierra LeoneanSiouxSlavicSlovakSloveneSomaliSouth AfricanSouth AmericanSouth American IndianSoviet UnionSpaniardSpanishSpanish AmericanSpanish American IndianSri LankanSubsaharan AfricanSudaneseSwedishSwissSyrianTaiwaneseThaiTlingit-HaidaTohono O'OdhamTonganTrinidadian and TobagonianTsimshianTurkishU.S. Virgin IslanderUgandanUkrainianUruguayanUteVenezuelanVietnameseWelshWest IndianYakamaYaquiYugoslavianYumanYup'ikZimbabwean
Immigration
NonimmigrantsImmigrantsAfghanistanAfricaAlbaniaArgentinaArmeniaAsiaAustraliaAustriaBahamasBangladeshBarbadosBelarusBelgiumBelizeBoliviaBosnia and HerzegovinaBrazilBulgariaBurma/MyanmarCabo VerdeCambodiaCameroonCanadaCaribbeanCentral AmericaChileChinaColombiaCongoCosta RicaCroatiaCubaCzechoslovakiaDenmarkDominicaDominican RepublicEastern AfricaEastern AsiaEastern EuropeEcuadorEgyptEl SalvadorEnglandEritreaEthiopiaEuropeFijiFranceGermanyGhanaGreeceGrenadaGuatemalaGuyanaHaitiHondurasHong KongHungaryIndiaIndonesiaIranIraqIrelandIsraelItalyJamaicaJapanJordanKazakhstanKenyaKoreaKuwaitLaosLatin AmericaLatviaLebanonLiberiaLithuaniaMalaysiaMexicoMicronesiaMiddle AfricaMoldovaMoroccoNepalNetherlandsNicaraguaNigeriaNorth AmericaNorth MacedoniaNorthern AfricaNorthern EuropeNorwayOceaniaPakistanPanamaPeruPhilippinesPolandPortugalRomaniaRussiaSaudi ArabiaScotlandSenegalSierra LeoneSingaporeSomaliaSouth AfricaSouth AmericaSouth Central AsiaSouth Eastern AsiaSouthern EuropeSpainSri LankaSt. Vincent and the GrenadinesSudanSwedenSwitzerlandSyriaTaiwanThailandTrinidad and TobagoTurkeyUgandaUkraineUruguayUzbekistanVenezuelaVietnamWest IndiesWestern AfricaWestern AsiaWestern EuropeYemenZaireZimbabweAzores
Immigrants from Serbia
Race
Ancestry
AfghanAfricanAlaska NativeAlaskan AthabascanAlbanianAleutAlsatianAmericanApacheArabArapahoArgentineanArmenianAssyrian/Chaldean/SyriacAustralianAustrianBangladeshiBarbadianBasqueBelgianBelizeanBermudanBhutaneseBlackfeetBolivianBrazilianBritishBritish West IndianBulgarianBurmeseCajunCambodianCanadianCape VerdeanCarpatho RusynCelticCentral AmericanCentral American IndianCherokeeCheyenneChickasawChileanChineseChippewaChoctawColombianColvilleComancheCosta RicanCreeCreekCroatianCrowCubanCypriotCzechCzechoslovakianDanishDelawareDominicanDutchDutch West IndianEastern EuropeanEcuadorianEgyptianEnglishEstonianEthiopianEuropeanFijianFilipinoFinnishFrenchFrench American IndianFrench CanadianGermanGerman RussianGhanaianGreekGuamanian/ChamorroGuatemalanGuyaneseHaitianHmongHonduranHopiHoumaHungarianIcelanderIndian (Asian)IndonesianInupiatIranianIraqiIrishIroquoisIsraeliItalianJamaicanJapaneseJordanianKenyanKiowaKoreanLaotianLatvianLebaneseLiberianLithuanianLumbeeLuxembourgerMacedonianMalaysianMalteseMarshalleseMenomineeMexicanMexican American IndianMongolianMoroccanNative HawaiianNavajoNepaleseNew ZealanderNicaraguanNigerianNorthern EuropeanNorwegianOkinawanOsageOttawaPaiutePakistaniPalestinianPanamanianParaguayanPennsylvania GermanPeruvianPimaPolishPortuguesePotawatomiPuebloPuerto RicanPuget Sound SalishRomanianRussianSalvadoranSamoanScandinavianScotch-IrishScottishSeminoleSenegaleseSerbianShoshoneSierra LeoneanSiouxSlavicSlovakSloveneSomaliSouth AfricanSouth AmericanSouth American IndianSoviet UnionSpaniardSpanishSpanish AmericanSpanish American IndianSri LankanSubsaharan AfricanSudaneseSwedishSwissSyrianTaiwaneseThaiTlingit-HaidaTohono O'OdhamTonganTrinidadian and TobagonianTsimshianTurkishU.S. Virgin IslanderUgandanUkrainianUruguayanUteVenezuelanVietnameseWelshWest IndianYakamaYaquiYugoslavianYumanYup'ikZimbabwean
Immigration
NonimmigrantsImmigrantsAfghanistanAfricaAlbaniaArgentinaArmeniaAsiaAustraliaAustriaBahamasBangladeshBarbadosBelarusBelgiumBelizeBoliviaBosnia and HerzegovinaBrazilBulgariaBurma/MyanmarCabo VerdeCambodiaCameroonCanadaCaribbeanCentral AmericaChileChinaColombiaCongoCosta RicaCroatiaCubaCzechoslovakiaDenmarkDominicaDominican RepublicEastern AfricaEastern AsiaEastern EuropeEcuadorEgyptEl SalvadorEnglandEritreaEthiopiaEuropeFijiFranceGermanyGhanaGreeceGrenadaGuatemalaGuyanaHaitiHondurasHong KongHungaryIndiaIndonesiaIranIraqIrelandIsraelItalyJamaicaJapanJordanKazakhstanKenyaKoreaKuwaitLaosLatin AmericaLatviaLebanonLiberiaLithuaniaMalaysiaMexicoMicronesiaMiddle AfricaMoldovaMoroccoNepalNetherlandsNicaraguaNigeriaNorth AmericaNorth MacedoniaNorthern AfricaNorthern EuropeNorwayOceaniaPakistanPanamaPeruPhilippinesPolandPortugalRomaniaRussiaSaudi ArabiaScotlandSenegalSerbiaSierra LeoneSingaporeSomaliaSouth AfricaSouth AmericaSouth Central AsiaSouth Eastern AsiaSouthern EuropeSpainSri LankaSt. Vincent and the GrenadinesSudanSwedenSwitzerlandSyriaTaiwanThailandTrinidad and TobagoTurkeyUgandaUkraineUruguayUzbekistanVenezuelaVietnamWest IndiesWestern AfricaWestern AsiaWestern EuropeYemenZaireZimbabweAzores
Unemployment Among Youth under 25 years
Income
Poverty
Unemployment
Labor Participation
Family Structure
Vehicle Availability
Education Level
Disability

Unemployment Among Youth under 25 years Comparison

Bahamians

Immigrants from Serbia

Tragic
Exceptional
13.1%
UNEMPLOYMENT AMONG YOUTH UNDER 25 YEARS
0.0/ 100
METRIC RATING
277th/ 347
METRIC RANK
11.3%
UNEMPLOYMENT AMONG YOUTH UNDER 25 YEARS
94.4/ 100
METRIC RATING
96th/ 347
METRIC RANK

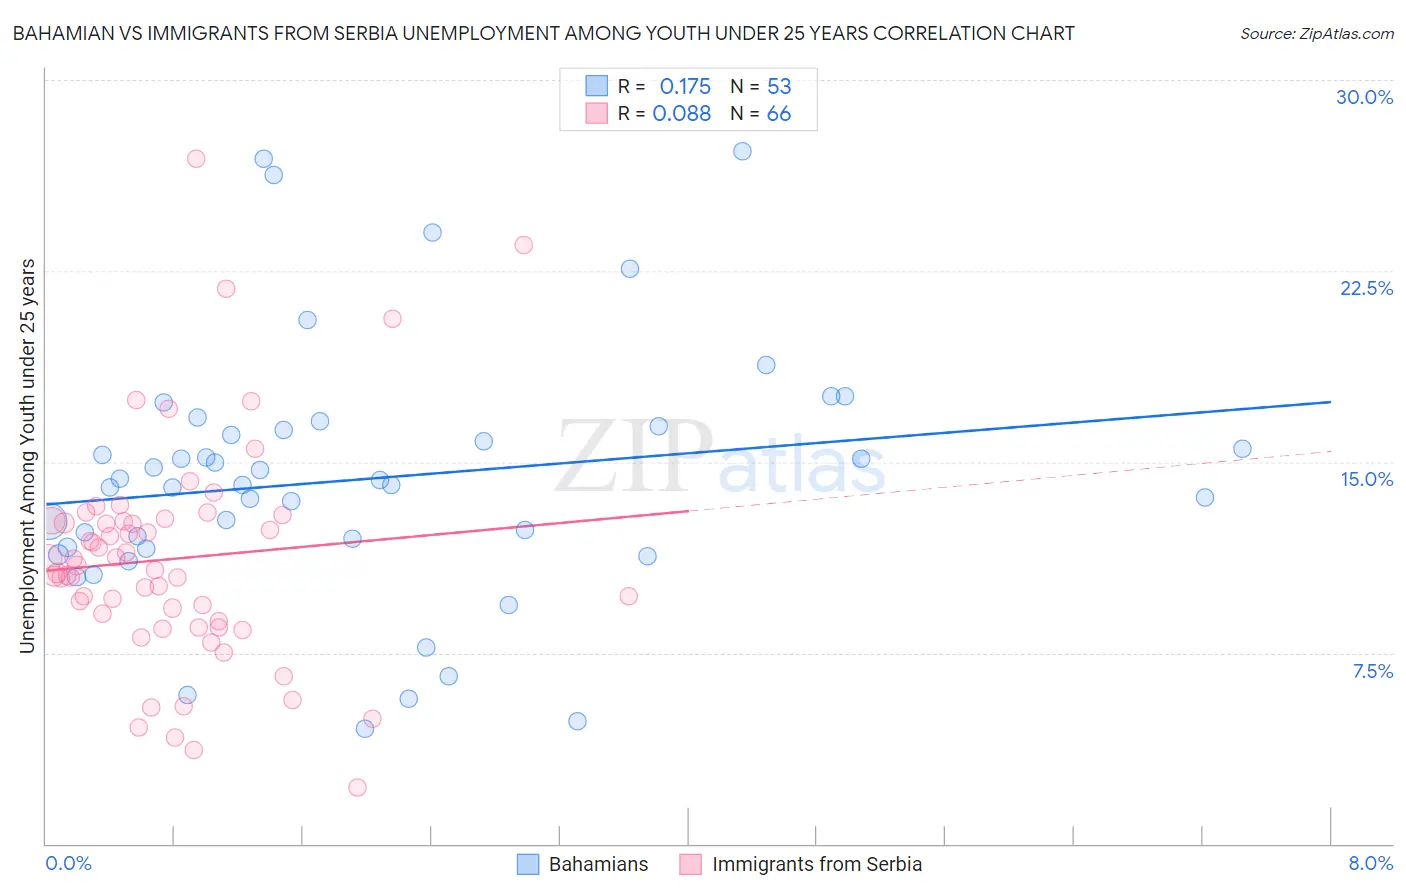
Bahamian vs Immigrants from Serbia Unemployment Among Youth under 25 years Correlation Chart

The statistical analysis conducted on geographies consisting of 112,437,072 people shows a poor positive correlation between the proportion of Bahamians and unemployment rate among youth under the age of 25 in the United States with a correlation coefficient (R) of 0.175 and weighted average of 13.1%. Similarly, the statistical analysis conducted on geographies consisting of 131,220,496 people shows a slight positive correlation between the proportion of Immigrants from Serbia and unemployment rate among youth under the age of 25 in the United States with a correlation coefficient (R) of 0.088 and weighted average of 11.3%, a difference of 16.5%.
Bahamian vs Immigrants from Serbia Unemployment Among Youth under 25 years

Unemployment Among Youth under 25 years Correlation Summary

MeasurementBahamianImmigrants from Serbia
Minimum4.5%2.2%
Maximum27.2%26.9%
Range22.7%24.7%
Mean14.3%11.2%
Median14.1%10.8%
Interquartile 25% (IQ1)11.6%8.7%
Interquartile 75% (IQ3)16.3%12.7%
Interquartile Range (IQR)4.7%3.9%
Standard Deviation (Sample)5.0%4.4%
Standard Deviation (Population)5.0%4.4%

Similar Demographics by Unemployment Among Youth under 25 years

Demographics Similar to Bahamians by Unemployment Among Youth under 25 years

In terms of unemployment among youth under 25 years, the demographic groups most similar to Bahamians are Immigrants from Uzbekistan (13.1%, a difference of 0.17%), African (13.2%, a difference of 0.26%), Bermudan (13.0%, a difference of 0.60%), Immigrants from Nigeria (13.0%, a difference of 0.71%), and Cajun (13.2%, a difference of 0.92%).
DemographicsRating | RankUnemployment Among Youth under 25 years
Immigrants | Liberia
0.0
/100
|
#270
Tragic
12.8%
Immigrants | Bahamas
0.0
/100
|
#271
Tragic
12.9%
Cape Verdeans
0.0
/100
|
#272
Tragic
12.9%
Nigerians
0.0
/100
|
#273
Tragic
13.0%
Immigrants | Nigeria
0.0
/100
|
#274
Tragic
13.0%
Bermudans
0.0
/100
|
#275
Tragic
13.0%
Immigrants | Uzbekistan
0.0
/100
|
#276
Tragic
13.1%
Bahamians
0.0
/100
|
#277
Tragic
13.1%
Africans
0.0
/100
|
#278
Tragic
13.2%
Cajuns
0.0
/100
|
#279
Tragic
13.2%
Ute
0.0
/100
|
#280
Tragic
13.3%
Armenians
0.0
/100
|
#281
Tragic
13.3%
Sierra Leoneans
0.0
/100
|
#282
Tragic
13.3%
Immigrants | Cameroon
0.0
/100
|
#283
Tragic
13.3%
Lumbee
0.0
/100
|
#284
Tragic
13.3%

Demographics Similar to Immigrants from Serbia by Unemployment Among Youth under 25 years

In terms of unemployment among youth under 25 years, the demographic groups most similar to Immigrants from Serbia are Carpatho Rusyn (11.3%, a difference of 0.010%), Nicaraguan (11.3%, a difference of 0.020%), Estonian (11.3%, a difference of 0.020%), Celtic (11.3%, a difference of 0.070%), and Pakistani (11.3%, a difference of 0.080%).
DemographicsRating | RankUnemployment Among Youth under 25 years
Immigrants | Japan
95.5
/100
|
#89
Exceptional
11.2%
Immigrants | Bolivia
95.5
/100
|
#90
Exceptional
11.2%
Immigrants | Taiwan
95.1
/100
|
#91
Exceptional
11.2%
Immigrants | Latvia
95.1
/100
|
#92
Exceptional
11.2%
Immigrants | North America
95.1
/100
|
#93
Exceptional
11.2%
Lithuanians
94.8
/100
|
#94
Exceptional
11.3%
Carpatho Rusyns
94.4
/100
|
#95
Exceptional
11.3%
Immigrants | Serbia
94.4
/100
|
#96
Exceptional
11.3%
Nicaraguans
94.3
/100
|
#97
Exceptional
11.3%
Estonians
94.2
/100
|
#98
Exceptional
11.3%
Celtics
94.0
/100
|
#99
Exceptional
11.3%
Pakistanis
94.0
/100
|
#100
Exceptional
11.3%
Iroquois
93.8
/100
|
#101
Exceptional
11.3%
Immigrants | Thailand
93.6
/100
|
#102
Exceptional
11.3%
Immigrants | Malaysia
93.6
/100
|
#103
Exceptional
11.3%