Guyanese vs Immigrants from Fiji Unemployment Among Seniors over 75 years
COMPARE
Guyanese
Immigrants from Fiji
Unemployment Among Seniors over 75 years
Unemployment Among Seniors over 75 years Comparison
Guyanese
Immigrants from Fiji
7.6%
UNEMPLOYMENT AMONG SENIORS OVER 75 YEARS
100.0/ 100
METRIC RATING
31st/ 347
METRIC RANK
10.0%
UNEMPLOYMENT AMONG SENIORS OVER 75 YEARS
0.0/ 100
METRIC RATING
307th/ 347
METRIC RANK
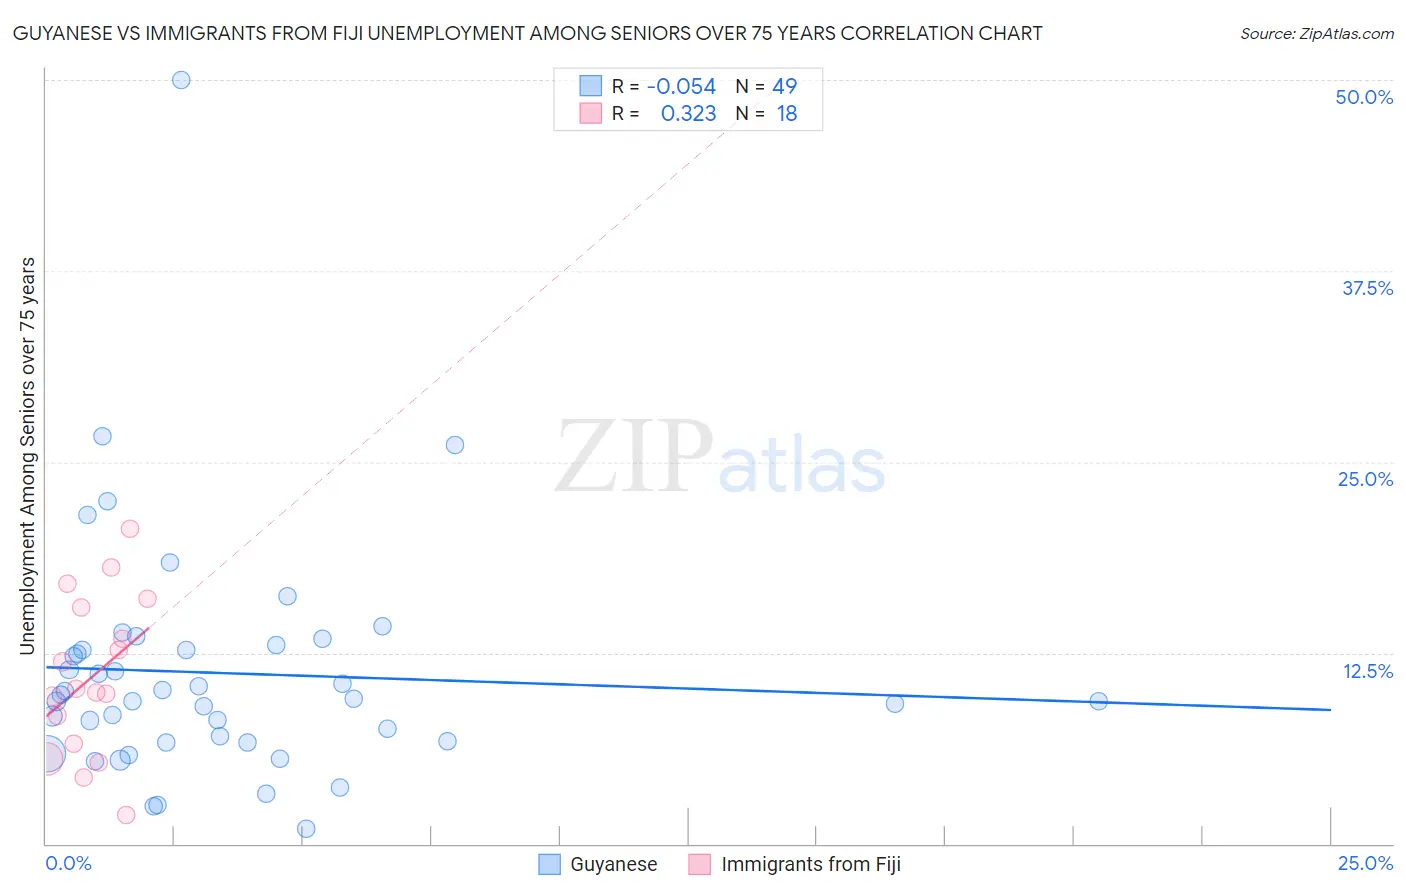
Guyanese vs Immigrants from Fiji Unemployment Among Seniors over 75 years Correlation Chart
The statistical analysis conducted on geographies consisting of 115,232,010 people shows a slight negative correlation between the proportion of Guyanese and unemployment rate among seniors over the age of 75 in the United States with a correlation coefficient (R) of -0.054 and weighted average of 7.6%. Similarly, the statistical analysis conducted on geographies consisting of 71,825,533 people shows a mild positive correlation between the proportion of Immigrants from Fiji and unemployment rate among seniors over the age of 75 in the United States with a correlation coefficient (R) of 0.323 and weighted average of 10.0%, a difference of 31.7%.
Unemployment Among Seniors over 75 years Correlation Summary
| Measurement | Guyanese | Immigrants from Fiji |
| Minimum | 1.0% | 1.9% |
| Maximum | 50.0% | 20.6% |
| Range | 49.0% | 18.7% |
| Mean | 11.2% | 10.9% |
| Median | 9.5% | 10.0% |
| Interquartile 25% (IQ1) | 6.7% | 6.5% |
| Interquartile 75% (IQ3) | 12.9% | 15.4% |
| Interquartile Range (IQR) | 6.2% | 8.9% |
| Standard Deviation (Sample) | 7.9% | 5.2% |
| Standard Deviation (Population) | 7.8% | 5.0% |
Similar Demographics by Unemployment Among Seniors over 75 years
Demographics Similar to Guyanese by Unemployment Among Seniors over 75 years
In terms of unemployment among seniors over 75 years, the demographic groups most similar to Guyanese are Immigrants from Sweden (7.6%, a difference of 0.37%), Immigrants from Iran (7.6%, a difference of 0.48%), Immigrants from Hong Kong (7.6%, a difference of 0.50%), Cambodian (7.6%, a difference of 0.51%), and Immigrants from Israel (7.6%, a difference of 0.53%).
| Demographics | Rating | Rank | Unemployment Among Seniors over 75 years |
| Immigrants | Cuba | 100.0 /100 | #24 | Exceptional 7.4% |
| Immigrants | Uruguay | 100.0 /100 | #25 | Exceptional 7.5% |
| South Africans | 100.0 /100 | #26 | Exceptional 7.5% |
| Immigrants | Barbados | 100.0 /100 | #27 | Exceptional 7.6% |
| Immigrants | Israel | 100.0 /100 | #28 | Exceptional 7.6% |
| Immigrants | Iran | 100.0 /100 | #29 | Exceptional 7.6% |
| Immigrants | Sweden | 100.0 /100 | #30 | Exceptional 7.6% |
| Guyanese | 100.0 /100 | #31 | Exceptional 7.6% |
| Immigrants | Hong Kong | 100.0 /100 | #32 | Exceptional 7.6% |
| Cambodians | 100.0 /100 | #33 | Exceptional 7.6% |
| Immigrants | Eritrea | 100.0 /100 | #34 | Exceptional 7.7% |
| Immigrants | Norway | 100.0 /100 | #35 | Exceptional 7.7% |
| Luxembourgers | 100.0 /100 | #36 | Exceptional 7.7% |
| Immigrants | Hungary | 100.0 /100 | #37 | Exceptional 7.7% |
| Kiowa | 100.0 /100 | #38 | Exceptional 7.7% |
Demographics Similar to Immigrants from Fiji by Unemployment Among Seniors over 75 years
In terms of unemployment among seniors over 75 years, the demographic groups most similar to Immigrants from Fiji are Italian (10.0%, a difference of 0.13%), Swedish (10.0%, a difference of 0.27%), White/Caucasian (10.1%, a difference of 0.44%), Puget Sound Salish (10.0%, a difference of 0.47%), and Scotch-Irish (10.0%, a difference of 0.47%).
| Demographics | Rating | Rank | Unemployment Among Seniors over 75 years |
| Iraqis | 0.0 /100 | #300 | Tragic 9.9% |
| Welsh | 0.0 /100 | #301 | Tragic 10.0% |
| Finns | 0.0 /100 | #302 | Tragic 10.0% |
| Puget Sound Salish | 0.0 /100 | #303 | Tragic 10.0% |
| Scotch-Irish | 0.0 /100 | #304 | Tragic 10.0% |
| Swedes | 0.0 /100 | #305 | Tragic 10.0% |
| Italians | 0.0 /100 | #306 | Tragic 10.0% |
| Immigrants | Fiji | 0.0 /100 | #307 | Tragic 10.0% |
| Whites/Caucasians | 0.0 /100 | #308 | Tragic 10.1% |
| English | 0.0 /100 | #309 | Tragic 10.1% |
| Hungarians | 0.0 /100 | #310 | Tragic 10.1% |
| Scottish | 0.0 /100 | #311 | Tragic 10.1% |
| Chippewa | 0.0 /100 | #312 | Tragic 10.1% |
| Nepalese | 0.0 /100 | #313 | Tragic 10.1% |
| Dutch West Indians | 0.0 /100 | #314 | Tragic 10.2% |