Immigrants from Liberia vs French Unemployment Among Youth under 25 years
COMPARE
Immigrants from Liberia
French
Unemployment Among Youth under 25 years
Unemployment Among Youth under 25 years Comparison
Immigrants from Liberia
French
12.8%
UNEMPLOYMENT AMONG YOUTH UNDER 25 YEARS
0.0/ 100
METRIC RATING
270th/ 347
METRIC RANK
11.2%
UNEMPLOYMENT AMONG YOUTH UNDER 25 YEARS
97.1/ 100
METRIC RATING
75th/ 347
METRIC RANK
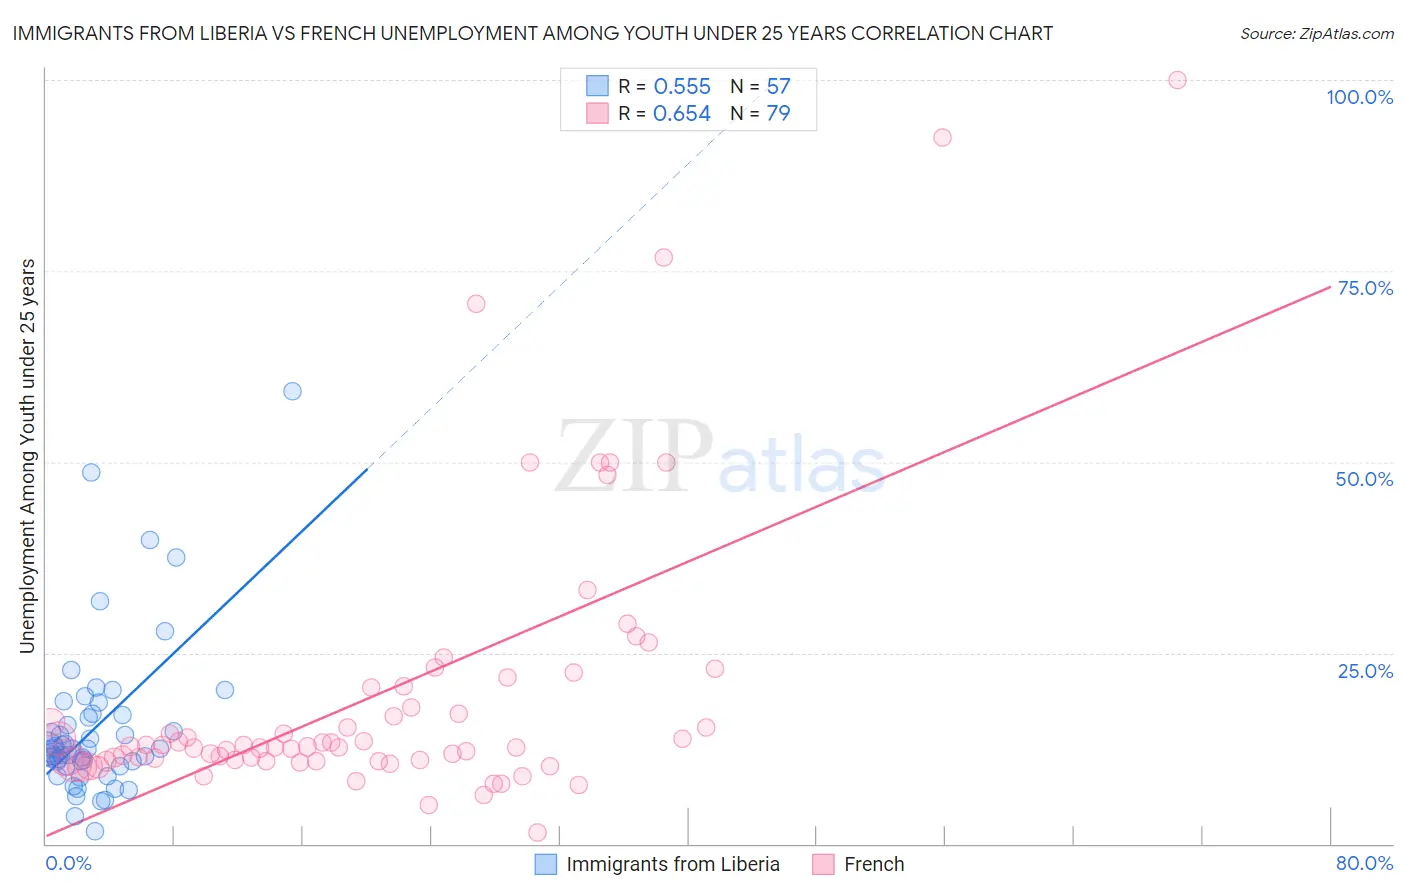
Immigrants from Liberia vs French Unemployment Among Youth under 25 years Correlation Chart
The statistical analysis conducted on geographies consisting of 134,836,783 people shows a substantial positive correlation between the proportion of Immigrants from Liberia and unemployment rate among youth under the age of 25 in the United States with a correlation coefficient (R) of 0.555 and weighted average of 12.8%. Similarly, the statistical analysis conducted on geographies consisting of 547,553,137 people shows a significant positive correlation between the proportion of French and unemployment rate among youth under the age of 25 in the United States with a correlation coefficient (R) of 0.654 and weighted average of 11.2%, a difference of 14.6%.
Unemployment Among Youth under 25 years Correlation Summary
| Measurement | Immigrants from Liberia | French |
| Minimum | 1.7% | 1.6% |
| Maximum | 59.3% | 100.0% |
| Range | 57.6% | 98.4% |
| Mean | 15.2% | 19.6% |
| Median | 12.4% | 12.7% |
| Interquartile 25% (IQ1) | 10.5% | 10.9% |
| Interquartile 75% (IQ3) | 17.0% | 20.4% |
| Interquartile Range (IQR) | 6.5% | 9.6% |
| Standard Deviation (Sample) | 10.4% | 18.5% |
| Standard Deviation (Population) | 10.3% | 18.4% |
Similar Demographics by Unemployment Among Youth under 25 years
Demographics Similar to Immigrants from Liberia by Unemployment Among Youth under 25 years
In terms of unemployment among youth under 25 years, the demographic groups most similar to Immigrants from Liberia are Immigrants from Bahamas (12.9%, a difference of 0.53%), Cape Verdean (12.9%, a difference of 0.75%), Nigerian (13.0%, a difference of 1.1%), Kiowa (12.7%, a difference of 1.1%), and Tlingit-Haida (12.7%, a difference of 1.3%).
| Demographics | Rating | Rank | Unemployment Among Youth under 25 years |
| Cree | 0.1 /100 | #263 | Tragic 12.4% |
| Puget Sound Salish | 0.1 /100 | #264 | Tragic 12.5% |
| Nepalese | 0.0 /100 | #265 | Tragic 12.5% |
| Immigrants | Latin America | 0.0 /100 | #266 | Tragic 12.6% |
| Sub-Saharan Africans | 0.0 /100 | #267 | Tragic 12.6% |
| Tlingit-Haida | 0.0 /100 | #268 | Tragic 12.7% |
| Kiowa | 0.0 /100 | #269 | Tragic 12.7% |
| Immigrants | Liberia | 0.0 /100 | #270 | Tragic 12.8% |
| Immigrants | Bahamas | 0.0 /100 | #271 | Tragic 12.9% |
| Cape Verdeans | 0.0 /100 | #272 | Tragic 12.9% |
| Nigerians | 0.0 /100 | #273 | Tragic 13.0% |
| Immigrants | Nigeria | 0.0 /100 | #274 | Tragic 13.0% |
| Bermudans | 0.0 /100 | #275 | Tragic 13.0% |
| Immigrants | Uzbekistan | 0.0 /100 | #276 | Tragic 13.1% |
| Bahamians | 0.0 /100 | #277 | Tragic 13.1% |
Demographics Similar to French by Unemployment Among Youth under 25 years
In terms of unemployment among youth under 25 years, the demographic groups most similar to French are German Russian (11.2%, a difference of 0.020%), New Zealander (11.2%, a difference of 0.030%), Creek (11.2%, a difference of 0.040%), White/Caucasian (11.2%, a difference of 0.080%), and Immigrants from Australia (11.2%, a difference of 0.090%).
| Demographics | Rating | Rank | Unemployment Among Youth under 25 years |
| Immigrants | Kenya | 97.6 /100 | #68 | Exceptional 11.2% |
| Immigrants | Moldova | 97.5 /100 | #69 | Exceptional 11.2% |
| Slavs | 97.5 /100 | #70 | Exceptional 11.2% |
| Bhutanese | 97.4 /100 | #71 | Exceptional 11.2% |
| Immigrants | Australia | 97.3 /100 | #72 | Exceptional 11.2% |
| Creek | 97.2 /100 | #73 | Exceptional 11.2% |
| New Zealanders | 97.2 /100 | #74 | Exceptional 11.2% |
| French | 97.1 /100 | #75 | Exceptional 11.2% |
| German Russians | 97.0 /100 | #76 | Exceptional 11.2% |
| Whites/Caucasians | 96.9 /100 | #77 | Exceptional 11.2% |
| Immigrants | Nicaragua | 96.7 /100 | #78 | Exceptional 11.2% |
| Immigrants | Canada | 96.7 /100 | #79 | Exceptional 11.2% |
| Immigrants | Bulgaria | 96.4 /100 | #80 | Exceptional 11.2% |
| Icelanders | 96.3 /100 | #81 | Exceptional 11.2% |
| Northern Europeans | 96.2 /100 | #82 | Exceptional 11.2% |