White/Caucasian vs French Unemployment Among Women with Children Under 18 years
COMPARE
White/Caucasian
French
Unemployment Among Women with Children Under 18 years
Unemployment Among Women with Children Under 18 years Comparison
Whites/Caucasians
French
5.3%
UNEMPLOYMENT AMONG WOMEN WITH CHILDREN UNDER 18 YEARS
82.9/ 100
METRIC RATING
127th/ 347
METRIC RANK
5.2%
UNEMPLOYMENT AMONG WOMEN WITH CHILDREN UNDER 18 YEARS
88.4/ 100
METRIC RATING
113th/ 347
METRIC RANK
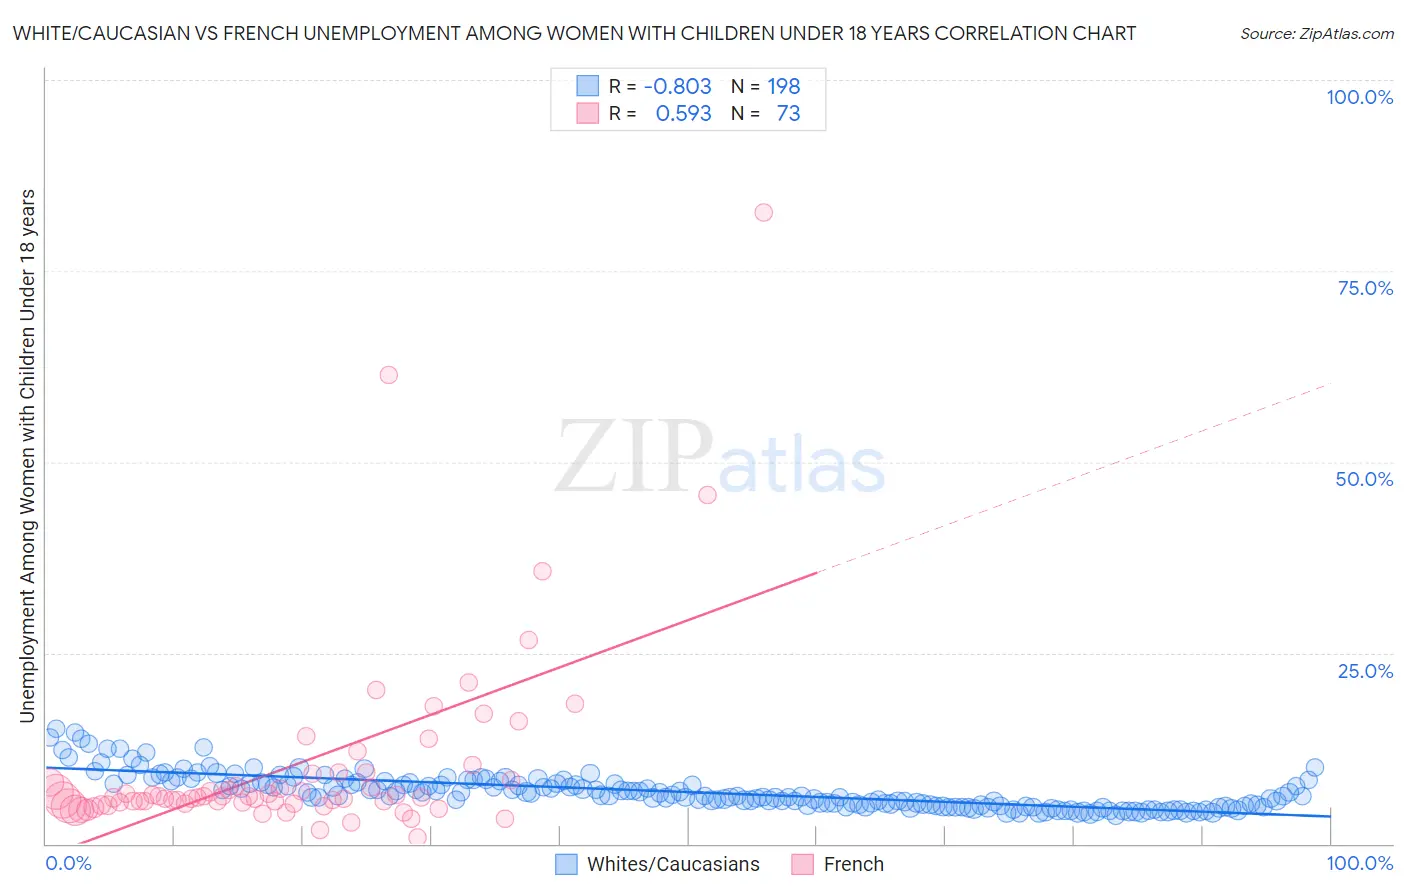
White/Caucasian vs French Unemployment Among Women with Children Under 18 years Correlation Chart
The statistical analysis conducted on geographies consisting of 523,047,491 people shows a very strong negative correlation between the proportion of Whites/Caucasians and unemployment rate among women with children under the age of 18 in the United States with a correlation coefficient (R) of -0.803 and weighted average of 5.3%. Similarly, the statistical analysis conducted on geographies consisting of 516,708,642 people shows a substantial positive correlation between the proportion of French and unemployment rate among women with children under the age of 18 in the United States with a correlation coefficient (R) of 0.593 and weighted average of 5.2%, a difference of 0.84%.
Unemployment Among Women with Children Under 18 years Correlation Summary
| Measurement | White/Caucasian | French |
| Minimum | 3.7% | 0.90% |
| Maximum | 15.1% | 82.7% |
| Range | 11.4% | 81.8% |
| Mean | 6.8% | 10.2% |
| Median | 6.2% | 6.0% |
| Interquartile 25% (IQ1) | 4.9% | 5.2% |
| Interquartile 75% (IQ3) | 8.0% | 8.8% |
| Interquartile Range (IQR) | 3.0% | 3.5% |
| Standard Deviation (Sample) | 2.3% | 12.8% |
| Standard Deviation (Population) | 2.3% | 12.7% |
Demographics Similar to Whites/Caucasians and French by Unemployment Among Women with Children Under 18 years
In terms of unemployment among women with children under 18 years, the demographic groups most similar to Whites/Caucasians are Immigrants from South Africa (5.3%, a difference of 0.010%), Immigrants from Oceania (5.3%, a difference of 0.030%), Immigrants from North Macedonia (5.3%, a difference of 0.040%), Immigrants from Italy (5.3%, a difference of 0.070%), and Immigrants from Austria (5.3%, a difference of 0.10%). Similarly, the demographic groups most similar to French are Immigrants from Eastern Europe (5.2%, a difference of 0.010%), Kenyan (5.3%, a difference of 0.040%), Hungarian (5.3%, a difference of 0.050%), Immigrants from Czechoslovakia (5.2%, a difference of 0.090%), and French Canadian (5.2%, a difference of 0.090%).
| Demographics | Rating | Rank | Unemployment Among Women with Children Under 18 years |
| Immigrants | Czechoslovakia | 88.9 /100 | #110 | Excellent 5.2% |
| French Canadians | 88.9 /100 | #111 | Excellent 5.2% |
| Immigrants | Eastern Europe | 88.5 /100 | #112 | Excellent 5.2% |
| French | 88.4 /100 | #113 | Excellent 5.2% |
| Kenyans | 88.2 /100 | #114 | Excellent 5.3% |
| Hungarians | 88.1 /100 | #115 | Excellent 5.3% |
| Macedonians | 87.7 /100 | #116 | Excellent 5.3% |
| Canadians | 87.4 /100 | #117 | Excellent 5.3% |
| Immigrants | Europe | 86.7 /100 | #118 | Excellent 5.3% |
| Basques | 86.5 /100 | #119 | Excellent 5.3% |
| Egyptians | 86.4 /100 | #120 | Excellent 5.3% |
| Immigrants | Romania | 85.8 /100 | #121 | Excellent 5.3% |
| Scotch-Irish | 85.7 /100 | #122 | Excellent 5.3% |
| Sudanese | 84.3 /100 | #123 | Excellent 5.3% |
| Native Hawaiians | 84.0 /100 | #124 | Excellent 5.3% |
| Immigrants | North Macedonia | 83.2 /100 | #125 | Excellent 5.3% |
| Immigrants | Oceania | 83.1 /100 | #126 | Excellent 5.3% |
| Whites/Caucasians | 82.9 /100 | #127 | Excellent 5.3% |
| Immigrants | South Africa | 82.8 /100 | #128 | Excellent 5.3% |
| Immigrants | Italy | 82.3 /100 | #129 | Excellent 5.3% |
| Immigrants | Austria | 82.1 /100 | #130 | Excellent 5.3% |