Welsh vs Mongolian Male Unemployment
COMPARE
Welsh
Mongolian
Male Unemployment
Male Unemployment Comparison
Welsh
Mongolians
4.8%
MALE UNEMPLOYMENT
99.7/ 100
METRIC RATING
34th/ 347
METRIC RANK
5.1%
MALE UNEMPLOYMENT
88.4/ 100
METRIC RATING
121st/ 347
METRIC RANK
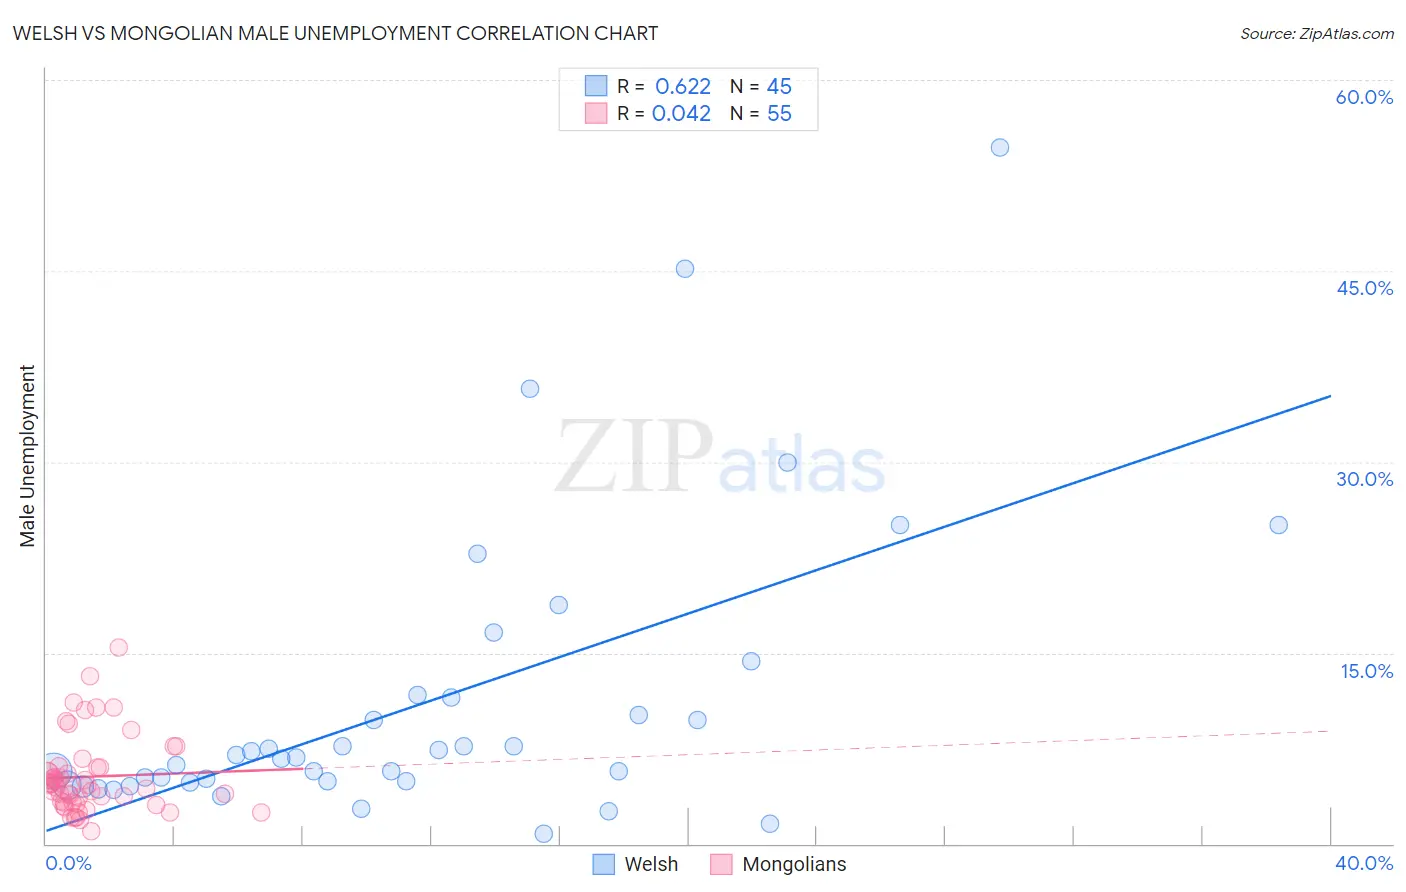
Welsh vs Mongolian Male Unemployment Correlation Chart
The statistical analysis conducted on geographies consisting of 521,279,877 people shows a significant positive correlation between the proportion of Welsh and unemployment rate among males in the United States with a correlation coefficient (R) of 0.622 and weighted average of 4.8%. Similarly, the statistical analysis conducted on geographies consisting of 140,285,925 people shows no correlation between the proportion of Mongolians and unemployment rate among males in the United States with a correlation coefficient (R) of 0.042 and weighted average of 5.1%, a difference of 5.9%.
Male Unemployment Correlation Summary
| Measurement | Welsh | Mongolian |
| Minimum | 0.80% | 1.0% |
| Maximum | 54.7% | 15.4% |
| Range | 53.9% | 14.4% |
| Mean | 11.1% | 5.3% |
| Median | 6.8% | 4.6% |
| Interquartile 25% (IQ1) | 4.9% | 3.2% |
| Interquartile 75% (IQ3) | 11.6% | 6.0% |
| Interquartile Range (IQR) | 6.7% | 2.8% |
| Standard Deviation (Sample) | 11.5% | 3.0% |
| Standard Deviation (Population) | 11.3% | 3.0% |
Similar Demographics by Male Unemployment
Demographics Similar to Welsh by Male Unemployment
In terms of male unemployment, the demographic groups most similar to Welsh are Latvian (4.8%, a difference of 0.080%), Immigrants from Nepal (4.8%, a difference of 0.38%), Sudanese (4.8%, a difference of 0.40%), British (4.8%, a difference of 0.65%), and Paraguayan (4.9%, a difference of 0.85%).
| Demographics | Rating | Rank | Male Unemployment |
| Belgians | 99.9 /100 | #27 | Exceptional 4.8% |
| Bulgarians | 99.8 /100 | #28 | Exceptional 4.8% |
| Scottish | 99.8 /100 | #29 | Exceptional 4.8% |
| British | 99.8 /100 | #30 | Exceptional 4.8% |
| Sudanese | 99.8 /100 | #31 | Exceptional 4.8% |
| Immigrants | Nepal | 99.8 /100 | #32 | Exceptional 4.8% |
| Latvians | 99.7 /100 | #33 | Exceptional 4.8% |
| Welsh | 99.7 /100 | #34 | Exceptional 4.8% |
| Paraguayans | 99.5 /100 | #35 | Exceptional 4.9% |
| Immigrants | Singapore | 99.4 /100 | #36 | Exceptional 4.9% |
| Scotch-Irish | 99.4 /100 | #37 | Exceptional 4.9% |
| Immigrants | Bosnia and Herzegovina | 99.4 /100 | #38 | Exceptional 4.9% |
| Burmese | 99.3 /100 | #39 | Exceptional 4.9% |
| Northern Europeans | 99.3 /100 | #40 | Exceptional 4.9% |
| Chinese | 99.3 /100 | #41 | Exceptional 4.9% |
Demographics Similar to Mongolians by Male Unemployment
In terms of male unemployment, the demographic groups most similar to Mongolians are Ukrainian (5.1%, a difference of 0.010%), French Canadian (5.1%, a difference of 0.030%), Nicaraguan (5.1%, a difference of 0.030%), Cypriot (5.1%, a difference of 0.070%), and Estonian (5.1%, a difference of 0.10%).
| Demographics | Rating | Rank | Male Unemployment |
| Romanians | 89.8 /100 | #114 | Excellent 5.1% |
| Immigrants | Asia | 89.6 /100 | #115 | Excellent 5.1% |
| Immigrants | Denmark | 89.4 /100 | #116 | Excellent 5.1% |
| Estonians | 89.0 /100 | #117 | Excellent 5.1% |
| Cypriots | 88.8 /100 | #118 | Excellent 5.1% |
| French Canadians | 88.6 /100 | #119 | Excellent 5.1% |
| Ukrainians | 88.4 /100 | #120 | Excellent 5.1% |
| Mongolians | 88.4 /100 | #121 | Excellent 5.1% |
| Nicaraguans | 88.2 /100 | #122 | Excellent 5.1% |
| Palestinians | 87.7 /100 | #123 | Excellent 5.1% |
| Immigrants | Latvia | 87.5 /100 | #124 | Excellent 5.1% |
| Immigrants | Lithuania | 87.2 /100 | #125 | Excellent 5.1% |
| Immigrants | Colombia | 86.8 /100 | #126 | Excellent 5.1% |
| Immigrants | Brazil | 86.3 /100 | #127 | Excellent 5.2% |
| Hungarians | 85.1 /100 | #128 | Excellent 5.2% |