Welsh vs Cree Male Unemployment
COMPARE
Welsh
Cree
Male Unemployment
Male Unemployment Comparison
Welsh
Cree
4.8%
MALE UNEMPLOYMENT
99.7/ 100
METRIC RATING
34th/ 347
METRIC RANK
5.7%
MALE UNEMPLOYMENT
0.4/ 100
METRIC RATING
249th/ 347
METRIC RANK
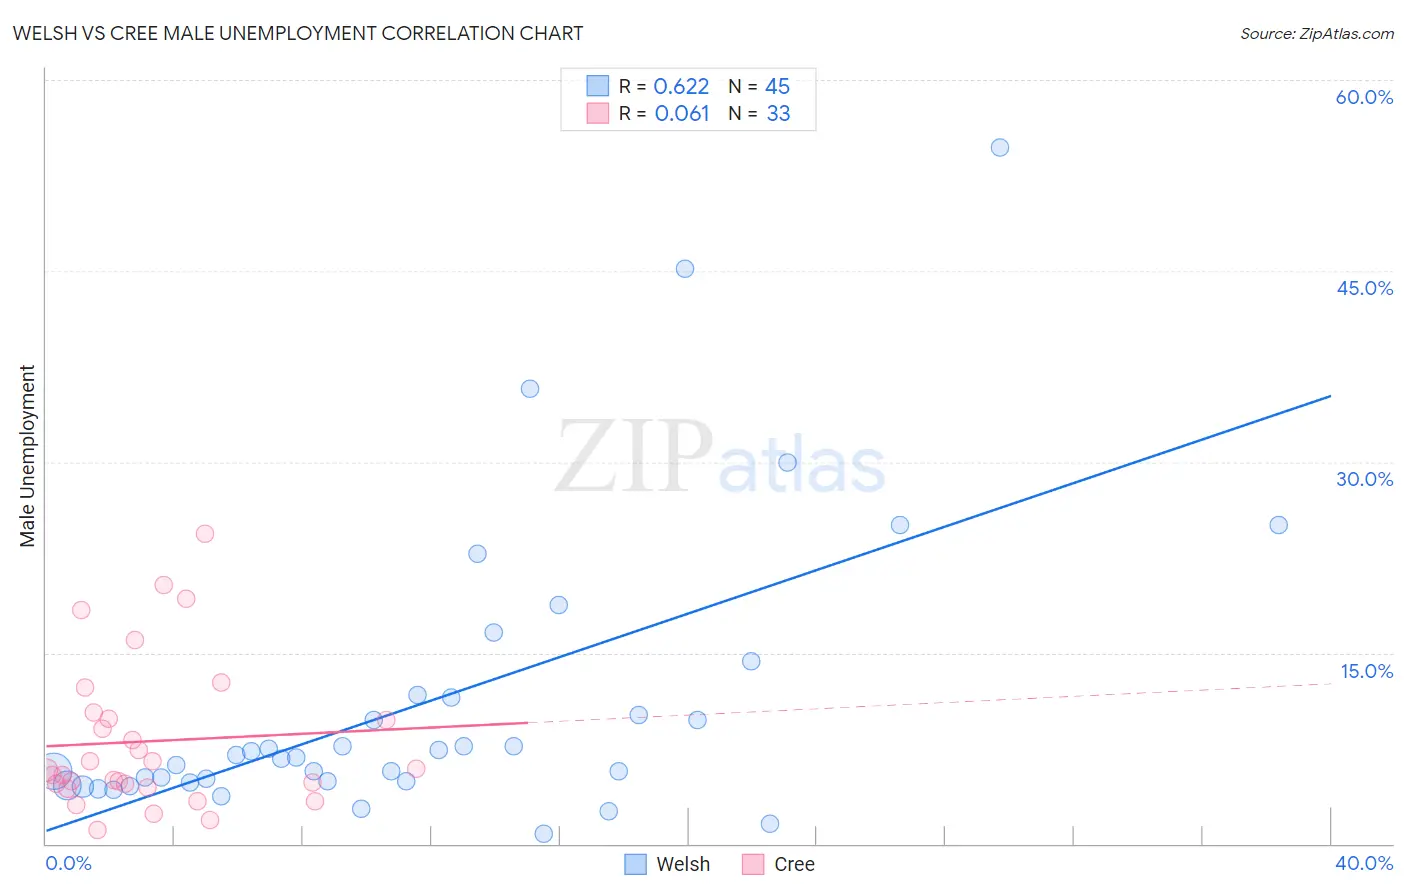
Welsh vs Cree Male Unemployment Correlation Chart
The statistical analysis conducted on geographies consisting of 521,279,877 people shows a significant positive correlation between the proportion of Welsh and unemployment rate among males in the United States with a correlation coefficient (R) of 0.622 and weighted average of 4.8%. Similarly, the statistical analysis conducted on geographies consisting of 76,096,114 people shows a slight positive correlation between the proportion of Cree and unemployment rate among males in the United States with a correlation coefficient (R) of 0.061 and weighted average of 5.7%, a difference of 17.9%.
Male Unemployment Correlation Summary
| Measurement | Welsh | Cree |
| Minimum | 0.80% | 1.1% |
| Maximum | 54.7% | 24.4% |
| Range | 53.9% | 23.3% |
| Mean | 11.1% | 8.1% |
| Median | 6.8% | 5.8% |
| Interquartile 25% (IQ1) | 4.9% | 4.5% |
| Interquartile 75% (IQ3) | 11.6% | 10.1% |
| Interquartile Range (IQR) | 6.7% | 5.5% |
| Standard Deviation (Sample) | 11.5% | 5.8% |
| Standard Deviation (Population) | 11.3% | 5.7% |
Similar Demographics by Male Unemployment
Demographics Similar to Welsh by Male Unemployment
In terms of male unemployment, the demographic groups most similar to Welsh are Latvian (4.8%, a difference of 0.080%), Immigrants from Nepal (4.8%, a difference of 0.38%), Sudanese (4.8%, a difference of 0.40%), British (4.8%, a difference of 0.65%), and Paraguayan (4.9%, a difference of 0.85%).
| Demographics | Rating | Rank | Male Unemployment |
| Belgians | 99.9 /100 | #27 | Exceptional 4.8% |
| Bulgarians | 99.8 /100 | #28 | Exceptional 4.8% |
| Scottish | 99.8 /100 | #29 | Exceptional 4.8% |
| British | 99.8 /100 | #30 | Exceptional 4.8% |
| Sudanese | 99.8 /100 | #31 | Exceptional 4.8% |
| Immigrants | Nepal | 99.8 /100 | #32 | Exceptional 4.8% |
| Latvians | 99.7 /100 | #33 | Exceptional 4.8% |
| Welsh | 99.7 /100 | #34 | Exceptional 4.8% |
| Paraguayans | 99.5 /100 | #35 | Exceptional 4.9% |
| Immigrants | Singapore | 99.4 /100 | #36 | Exceptional 4.9% |
| Scotch-Irish | 99.4 /100 | #37 | Exceptional 4.9% |
| Immigrants | Bosnia and Herzegovina | 99.4 /100 | #38 | Exceptional 4.9% |
| Burmese | 99.3 /100 | #39 | Exceptional 4.9% |
| Northern Europeans | 99.3 /100 | #40 | Exceptional 4.9% |
| Chinese | 99.3 /100 | #41 | Exceptional 4.9% |
Demographics Similar to Cree by Male Unemployment
In terms of male unemployment, the demographic groups most similar to Cree are Marshallese (5.7%, a difference of 0.070%), Immigrants from Bahamas (5.7%, a difference of 0.24%), Spanish American (5.7%, a difference of 0.29%), Hawaiian (5.7%, a difference of 0.39%), and Iroquois (5.7%, a difference of 0.48%).
| Demographics | Rating | Rank | Male Unemployment |
| Ottawa | 0.9 /100 | #242 | Tragic 5.7% |
| Bangladeshis | 0.8 /100 | #243 | Tragic 5.7% |
| Immigrants | El Salvador | 0.7 /100 | #244 | Tragic 5.7% |
| Yaqui | 0.7 /100 | #245 | Tragic 5.7% |
| Iroquois | 0.6 /100 | #246 | Tragic 5.7% |
| Hawaiians | 0.6 /100 | #247 | Tragic 5.7% |
| Marshallese | 0.5 /100 | #248 | Tragic 5.7% |
| Cree | 0.4 /100 | #249 | Tragic 5.7% |
| Immigrants | Bahamas | 0.4 /100 | #250 | Tragic 5.7% |
| Spanish Americans | 0.3 /100 | #251 | Tragic 5.7% |
| Mexicans | 0.2 /100 | #252 | Tragic 5.8% |
| Mexican American Indians | 0.2 /100 | #253 | Tragic 5.8% |
| Japanese | 0.2 /100 | #254 | Tragic 5.8% |
| Kiowa | 0.2 /100 | #255 | Tragic 5.8% |
| Comanche | 0.2 /100 | #256 | Tragic 5.8% |