Welsh vs Mongolian Unemployment Among Women with Children Under 6 years
COMPARE
Welsh
Mongolian
Unemployment Among Women with Children Under 6 years
Unemployment Among Women with Children Under 6 years Comparison
Welsh
Mongolians
8.0%
UNEMPLOYMENT AMONG WOMEN WITH CHILDREN UNDER 6 YEARS
5.0/ 100
METRIC RATING
232nd/ 347
METRIC RANK
6.5%
UNEMPLOYMENT AMONG WOMEN WITH CHILDREN UNDER 6 YEARS
100.0/ 100
METRIC RATING
19th/ 347
METRIC RANK
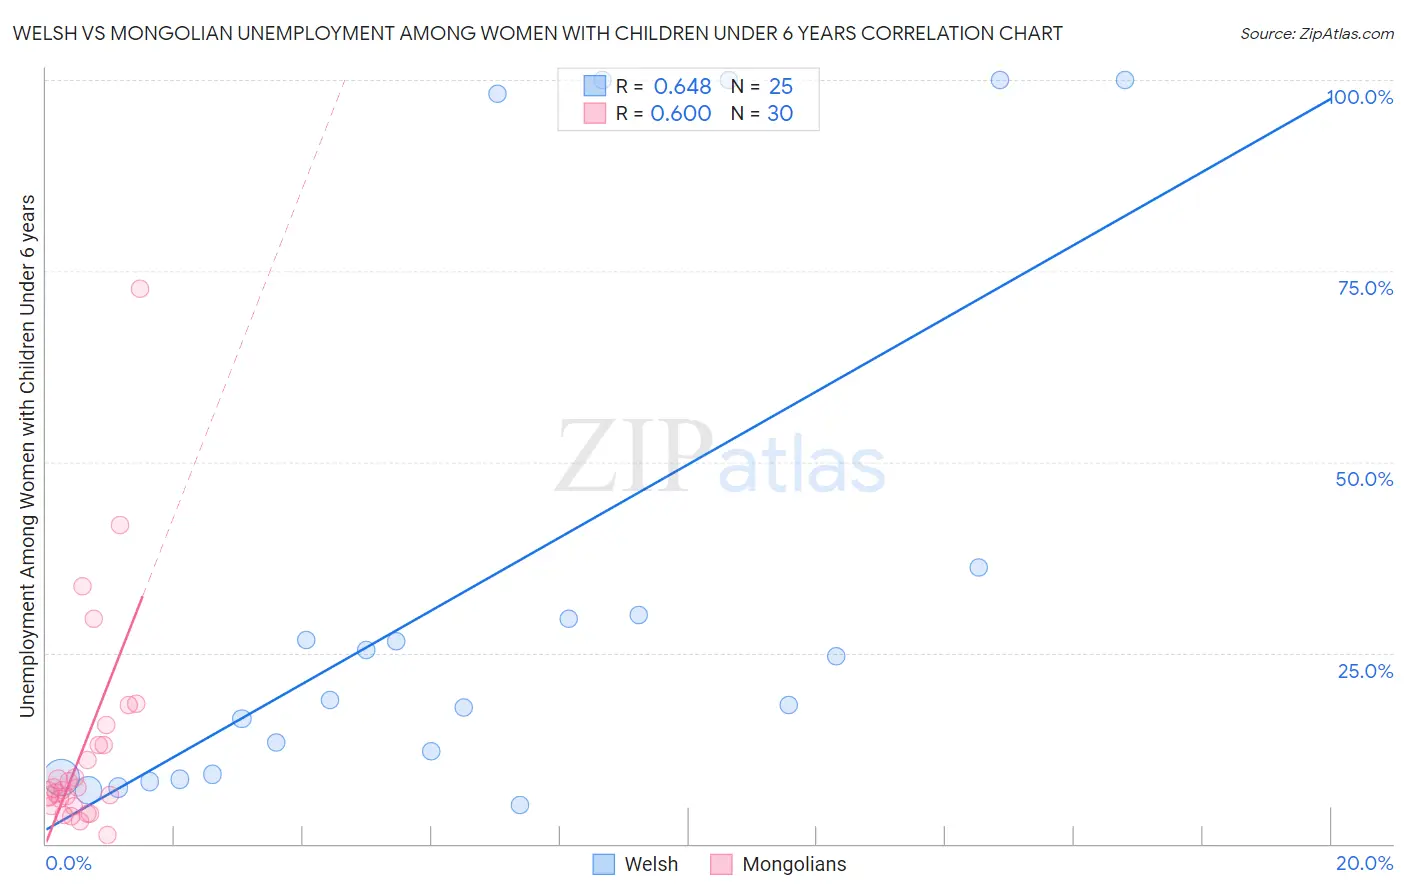
Welsh vs Mongolian Unemployment Among Women with Children Under 6 years Correlation Chart
The statistical analysis conducted on geographies consisting of 357,262,742 people shows a significant positive correlation between the proportion of Welsh and unemployment rate among women with children under the age of 6 in the United States with a correlation coefficient (R) of 0.648 and weighted average of 8.0%. Similarly, the statistical analysis conducted on geographies consisting of 125,353,250 people shows a substantial positive correlation between the proportion of Mongolians and unemployment rate among women with children under the age of 6 in the United States with a correlation coefficient (R) of 0.600 and weighted average of 6.5%, a difference of 23.8%.
Unemployment Among Women with Children Under 6 years Correlation Summary
| Measurement | Welsh | Mongolian |
| Minimum | 5.1% | 1.1% |
| Maximum | 100.0% | 72.7% |
| Range | 94.9% | 71.6% |
| Mean | 33.9% | 12.7% |
| Median | 18.8% | 7.2% |
| Interquartile 25% (IQ1) | 8.9% | 5.0% |
| Interquartile 75% (IQ3) | 33.0% | 13.0% |
| Interquartile Range (IQR) | 24.2% | 8.0% |
| Standard Deviation (Sample) | 34.6% | 14.7% |
| Standard Deviation (Population) | 33.9% | 14.5% |
Similar Demographics by Unemployment Among Women with Children Under 6 years
Demographics Similar to Welsh by Unemployment Among Women with Children Under 6 years
In terms of unemployment among women with children under 6 years, the demographic groups most similar to Welsh are Finnish (8.0%, a difference of 0.090%), Trinidadian and Tobagonian (8.0%, a difference of 0.090%), Immigrants from Trinidad and Tobago (8.0%, a difference of 0.090%), Salvadoran (8.0%, a difference of 0.16%), and Kiowa (8.0%, a difference of 0.23%).
| Demographics | Rating | Rank | Unemployment Among Women with Children Under 6 years |
| Germans | 7.0 /100 | #225 | Tragic 8.0% |
| Senegalese | 6.2 /100 | #226 | Tragic 8.0% |
| Portuguese | 6.2 /100 | #227 | Tragic 8.0% |
| Immigrants | Sudan | 6.0 /100 | #228 | Tragic 8.0% |
| Salvadorans | 5.5 /100 | #229 | Tragic 8.0% |
| Finns | 5.3 /100 | #230 | Tragic 8.0% |
| Trinidadians and Tobagonians | 5.3 /100 | #231 | Tragic 8.0% |
| Welsh | 5.0 /100 | #232 | Tragic 8.0% |
| Immigrants | Trinidad and Tobago | 4.8 /100 | #233 | Tragic 8.0% |
| Kiowa | 4.4 /100 | #234 | Tragic 8.0% |
| Comanche | 4.3 /100 | #235 | Tragic 8.0% |
| Immigrants | Barbados | 4.2 /100 | #236 | Tragic 8.0% |
| Immigrants | Costa Rica | 4.1 /100 | #237 | Tragic 8.0% |
| Immigrants | Middle Africa | 3.2 /100 | #238 | Tragic 8.1% |
| Irish | 2.7 /100 | #239 | Tragic 8.1% |
Demographics Similar to Mongolians by Unemployment Among Women with Children Under 6 years
In terms of unemployment among women with children under 6 years, the demographic groups most similar to Mongolians are Ute (6.5%, a difference of 0.050%), Burmese (6.5%, a difference of 0.10%), Assyrian/Chaldean/Syriac (6.5%, a difference of 0.32%), Immigrants from Korea (6.5%, a difference of 0.53%), and Bulgarian (6.5%, a difference of 0.73%).
| Demographics | Rating | Rank | Unemployment Among Women with Children Under 6 years |
| Immigrants | Singapore | 100.0 /100 | #12 | Exceptional 6.3% |
| Immigrants | Eastern Asia | 100.0 /100 | #13 | Exceptional 6.3% |
| Immigrants | Bulgaria | 100.0 /100 | #14 | Exceptional 6.3% |
| Thais | 100.0 /100 | #15 | Exceptional 6.3% |
| Immigrants | Uzbekistan | 100.0 /100 | #16 | Exceptional 6.3% |
| Immigrants | Malaysia | 100.0 /100 | #17 | Exceptional 6.4% |
| Assyrians/Chaldeans/Syriacs | 100.0 /100 | #18 | Exceptional 6.5% |
| Mongolians | 100.0 /100 | #19 | Exceptional 6.5% |
| Ute | 100.0 /100 | #20 | Exceptional 6.5% |
| Burmese | 100.0 /100 | #21 | Exceptional 6.5% |
| Immigrants | Korea | 100.0 /100 | #22 | Exceptional 6.5% |
| Bulgarians | 100.0 /100 | #23 | Exceptional 6.5% |
| Laotians | 100.0 /100 | #24 | Exceptional 6.5% |
| Soviet Union | 100.0 /100 | #25 | Exceptional 6.5% |
| Cypriots | 100.0 /100 | #26 | Exceptional 6.5% |