Welsh vs Kenyan Male Unemployment
COMPARE
Welsh
Kenyan
Male Unemployment
Male Unemployment Comparison
Welsh
Kenyans
4.8%
MALE UNEMPLOYMENT
99.7/ 100
METRIC RATING
34th/ 347
METRIC RANK
5.2%
MALE UNEMPLOYMENT
79.4/ 100
METRIC RATING
139th/ 347
METRIC RANK
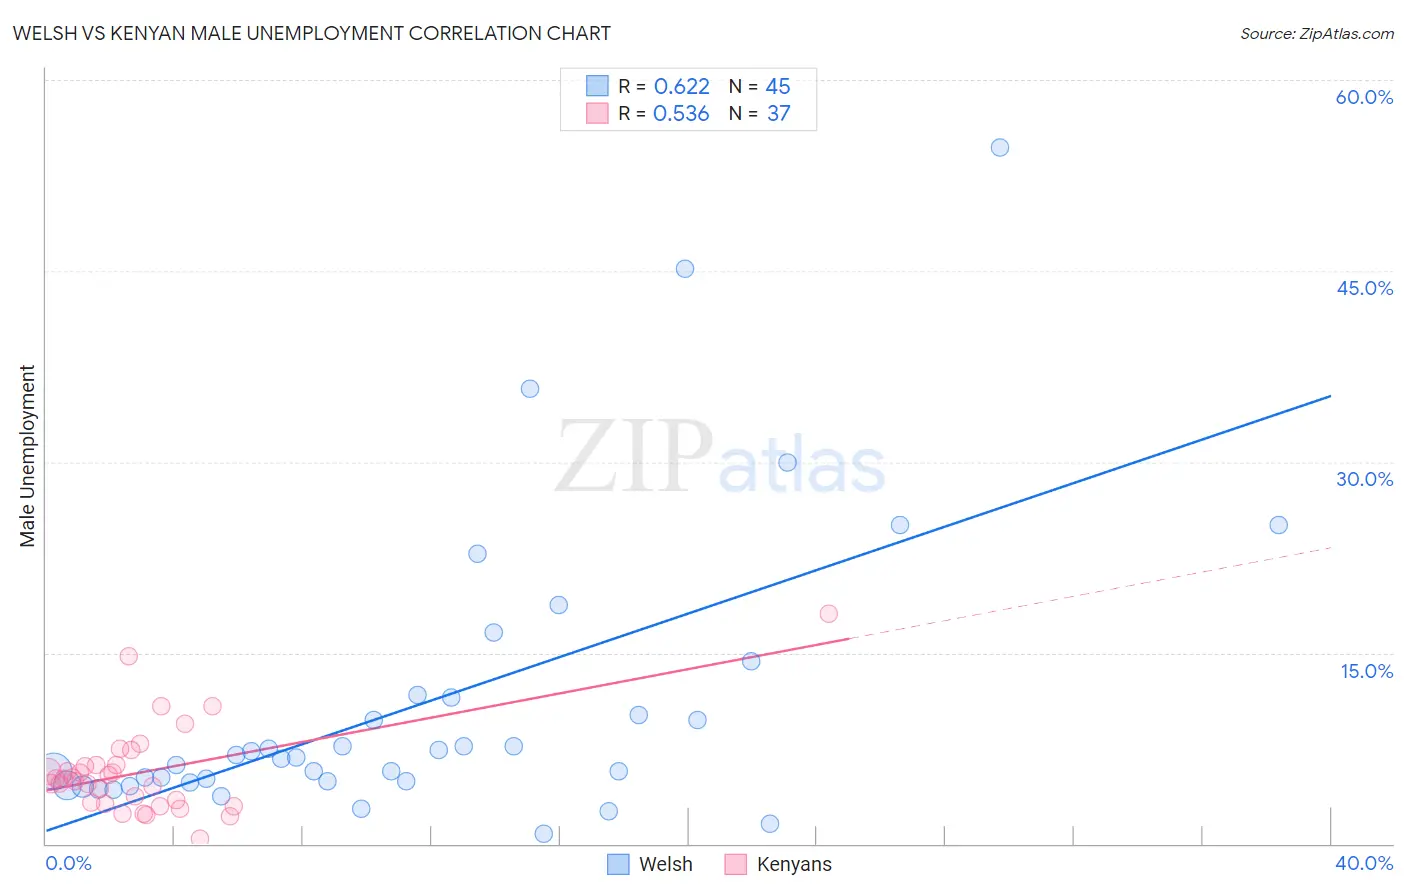
Welsh vs Kenyan Male Unemployment Correlation Chart
The statistical analysis conducted on geographies consisting of 521,279,877 people shows a significant positive correlation between the proportion of Welsh and unemployment rate among males in the United States with a correlation coefficient (R) of 0.622 and weighted average of 4.8%. Similarly, the statistical analysis conducted on geographies consisting of 168,001,564 people shows a substantial positive correlation between the proportion of Kenyans and unemployment rate among males in the United States with a correlation coefficient (R) of 0.536 and weighted average of 5.2%, a difference of 7.0%.
Male Unemployment Correlation Summary
| Measurement | Welsh | Kenyan |
| Minimum | 0.80% | 0.40% |
| Maximum | 54.7% | 18.1% |
| Range | 53.9% | 17.7% |
| Mean | 11.1% | 5.6% |
| Median | 6.8% | 5.1% |
| Interquartile 25% (IQ1) | 4.9% | 3.2% |
| Interquartile 75% (IQ3) | 11.6% | 6.2% |
| Interquartile Range (IQR) | 6.7% | 3.0% |
| Standard Deviation (Sample) | 11.5% | 3.5% |
| Standard Deviation (Population) | 11.3% | 3.5% |
Similar Demographics by Male Unemployment
Demographics Similar to Welsh by Male Unemployment
In terms of male unemployment, the demographic groups most similar to Welsh are Latvian (4.8%, a difference of 0.080%), Immigrants from Nepal (4.8%, a difference of 0.38%), Sudanese (4.8%, a difference of 0.40%), British (4.8%, a difference of 0.65%), and Paraguayan (4.9%, a difference of 0.85%).
| Demographics | Rating | Rank | Male Unemployment |
| Belgians | 99.9 /100 | #27 | Exceptional 4.8% |
| Bulgarians | 99.8 /100 | #28 | Exceptional 4.8% |
| Scottish | 99.8 /100 | #29 | Exceptional 4.8% |
| British | 99.8 /100 | #30 | Exceptional 4.8% |
| Sudanese | 99.8 /100 | #31 | Exceptional 4.8% |
| Immigrants | Nepal | 99.8 /100 | #32 | Exceptional 4.8% |
| Latvians | 99.7 /100 | #33 | Exceptional 4.8% |
| Welsh | 99.7 /100 | #34 | Exceptional 4.8% |
| Paraguayans | 99.5 /100 | #35 | Exceptional 4.9% |
| Immigrants | Singapore | 99.4 /100 | #36 | Exceptional 4.9% |
| Scotch-Irish | 99.4 /100 | #37 | Exceptional 4.9% |
| Immigrants | Bosnia and Herzegovina | 99.4 /100 | #38 | Exceptional 4.9% |
| Burmese | 99.3 /100 | #39 | Exceptional 4.9% |
| Northern Europeans | 99.3 /100 | #40 | Exceptional 4.9% |
| Chinese | 99.3 /100 | #41 | Exceptional 4.9% |
Demographics Similar to Kenyans by Male Unemployment
In terms of male unemployment, the demographic groups most similar to Kenyans are Brazilian (5.2%, a difference of 0.010%), Immigrants from Croatia (5.2%, a difference of 0.020%), Immigrants from Switzerland (5.2%, a difference of 0.020%), Immigrants from Eastern Africa (5.2%, a difference of 0.030%), and Lebanese (5.2%, a difference of 0.040%).
| Demographics | Rating | Rank | Male Unemployment |
| Chickasaw | 82.9 /100 | #132 | Excellent 5.2% |
| Colombians | 81.1 /100 | #133 | Excellent 5.2% |
| Pakistanis | 80.5 /100 | #134 | Excellent 5.2% |
| Immigrants | Saudi Arabia | 80.1 /100 | #135 | Excellent 5.2% |
| Lebanese | 79.9 /100 | #136 | Good 5.2% |
| Immigrants | Eastern Africa | 79.8 /100 | #137 | Good 5.2% |
| Immigrants | Croatia | 79.7 /100 | #138 | Good 5.2% |
| Kenyans | 79.4 /100 | #139 | Good 5.2% |
| Brazilians | 79.3 /100 | #140 | Good 5.2% |
| Immigrants | Switzerland | 79.2 /100 | #141 | Good 5.2% |
| Fijians | 78.3 /100 | #142 | Good 5.2% |
| Syrians | 78.0 /100 | #143 | Good 5.2% |
| Sri Lankans | 77.9 /100 | #144 | Good 5.2% |
| Macedonians | 77.7 /100 | #145 | Good 5.2% |
| Immigrants | Kenya | 77.6 /100 | #146 | Good 5.2% |