Immigrants from West Indies vs Cree Male Unemployment
COMPARE
Immigrants from West Indies
Cree
Male Unemployment
Male Unemployment Comparison
Immigrants from West Indies
Cree
6.7%
MALE UNEMPLOYMENT
0.0/ 100
METRIC RATING
303rd/ 347
METRIC RANK
5.7%
MALE UNEMPLOYMENT
0.4/ 100
METRIC RATING
249th/ 347
METRIC RANK
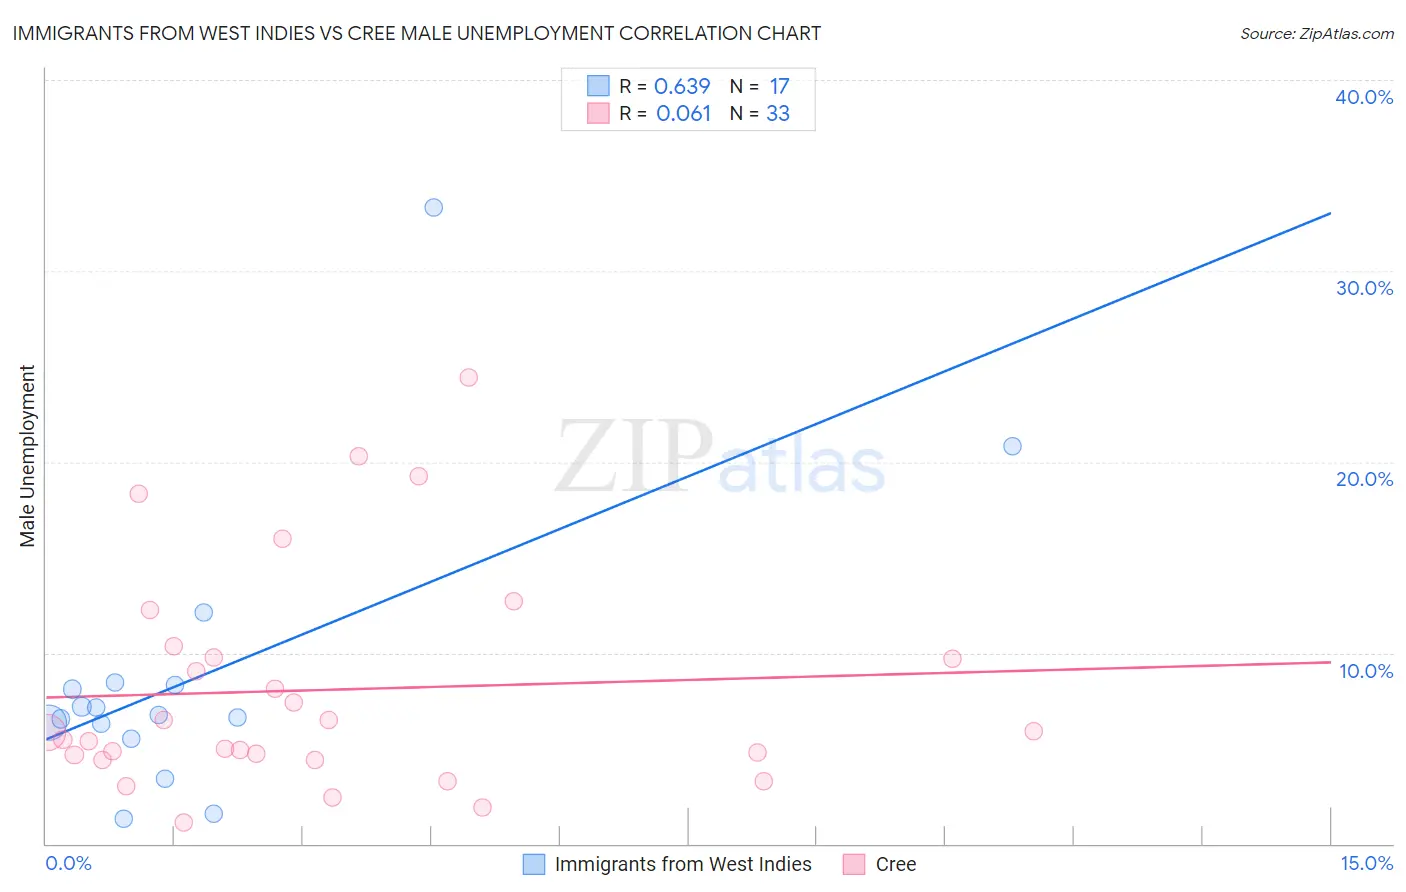
Immigrants from West Indies vs Cree Male Unemployment Correlation Chart
The statistical analysis conducted on geographies consisting of 72,422,402 people shows a significant positive correlation between the proportion of Immigrants from West Indies and unemployment rate among males in the United States with a correlation coefficient (R) of 0.639 and weighted average of 6.7%. Similarly, the statistical analysis conducted on geographies consisting of 76,096,114 people shows a slight positive correlation between the proportion of Cree and unemployment rate among males in the United States with a correlation coefficient (R) of 0.061 and weighted average of 5.7%, a difference of 16.5%.
Male Unemployment Correlation Summary
| Measurement | Immigrants from West Indies | Cree |
| Minimum | 1.3% | 1.1% |
| Maximum | 33.3% | 24.4% |
| Range | 32.0% | 23.3% |
| Mean | 8.8% | 8.1% |
| Median | 6.7% | 5.8% |
| Interquartile 25% (IQ1) | 5.9% | 4.5% |
| Interquartile 75% (IQ3) | 8.4% | 10.1% |
| Interquartile Range (IQR) | 2.5% | 5.5% |
| Standard Deviation (Sample) | 7.7% | 5.8% |
| Standard Deviation (Population) | 7.4% | 5.7% |
Similar Demographics by Male Unemployment
Demographics Similar to Immigrants from West Indies by Male Unemployment
In terms of male unemployment, the demographic groups most similar to Immigrants from West Indies are West Indian (6.7%, a difference of 0.0%), Trinidadian and Tobagonian (6.7%, a difference of 0.32%), Ute (6.6%, a difference of 0.36%), Immigrants from Trinidad and Tobago (6.7%, a difference of 0.52%), and Immigrants from Jamaica (6.7%, a difference of 0.60%).
| Demographics | Rating | Rank | Male Unemployment |
| Immigrants | Haiti | 0.0 /100 | #296 | Tragic 6.5% |
| Chippewa | 0.0 /100 | #297 | Tragic 6.6% |
| Jamaicans | 0.0 /100 | #298 | Tragic 6.6% |
| Immigrants | Bangladesh | 0.0 /100 | #299 | Tragic 6.6% |
| Vietnamese | 0.0 /100 | #300 | Tragic 6.6% |
| Immigrants | Belize | 0.0 /100 | #301 | Tragic 6.6% |
| Ute | 0.0 /100 | #302 | Tragic 6.6% |
| Immigrants | West Indies | 0.0 /100 | #303 | Tragic 6.7% |
| West Indians | 0.0 /100 | #304 | Tragic 6.7% |
| Trinidadians and Tobagonians | 0.0 /100 | #305 | Tragic 6.7% |
| Immigrants | Trinidad and Tobago | 0.0 /100 | #306 | Tragic 6.7% |
| Immigrants | Jamaica | 0.0 /100 | #307 | Tragic 6.7% |
| Aleuts | 0.0 /100 | #308 | Tragic 6.8% |
| Barbadians | 0.0 /100 | #309 | Tragic 6.9% |
| Blacks/African Americans | 0.0 /100 | #310 | Tragic 6.9% |
Demographics Similar to Cree by Male Unemployment
In terms of male unemployment, the demographic groups most similar to Cree are Marshallese (5.7%, a difference of 0.070%), Immigrants from Bahamas (5.7%, a difference of 0.24%), Spanish American (5.7%, a difference of 0.29%), Hawaiian (5.7%, a difference of 0.39%), and Iroquois (5.7%, a difference of 0.48%).
| Demographics | Rating | Rank | Male Unemployment |
| Ottawa | 0.9 /100 | #242 | Tragic 5.7% |
| Bangladeshis | 0.8 /100 | #243 | Tragic 5.7% |
| Immigrants | El Salvador | 0.7 /100 | #244 | Tragic 5.7% |
| Yaqui | 0.7 /100 | #245 | Tragic 5.7% |
| Iroquois | 0.6 /100 | #246 | Tragic 5.7% |
| Hawaiians | 0.6 /100 | #247 | Tragic 5.7% |
| Marshallese | 0.5 /100 | #248 | Tragic 5.7% |
| Cree | 0.4 /100 | #249 | Tragic 5.7% |
| Immigrants | Bahamas | 0.4 /100 | #250 | Tragic 5.7% |
| Spanish Americans | 0.3 /100 | #251 | Tragic 5.7% |
| Mexicans | 0.2 /100 | #252 | Tragic 5.8% |
| Mexican American Indians | 0.2 /100 | #253 | Tragic 5.8% |
| Japanese | 0.2 /100 | #254 | Tragic 5.8% |
| Kiowa | 0.2 /100 | #255 | Tragic 5.8% |
| Comanche | 0.2 /100 | #256 | Tragic 5.8% |