Immigrants from Lithuania vs Sudanese Unemployment Among Women with Children Under 6 years
COMPARE
Immigrants from Lithuania
Sudanese
Unemployment Among Women with Children Under 6 years
Unemployment Among Women with Children Under 6 years Comparison
Immigrants from Lithuania
Sudanese
7.5%
UNEMPLOYMENT AMONG WOMEN WITH CHILDREN UNDER 6 YEARS
68.8/ 100
METRIC RATING
162nd/ 347
METRIC RANK
7.8%
UNEMPLOYMENT AMONG WOMEN WITH CHILDREN UNDER 6 YEARS
23.5/ 100
METRIC RATING
202nd/ 347
METRIC RANK
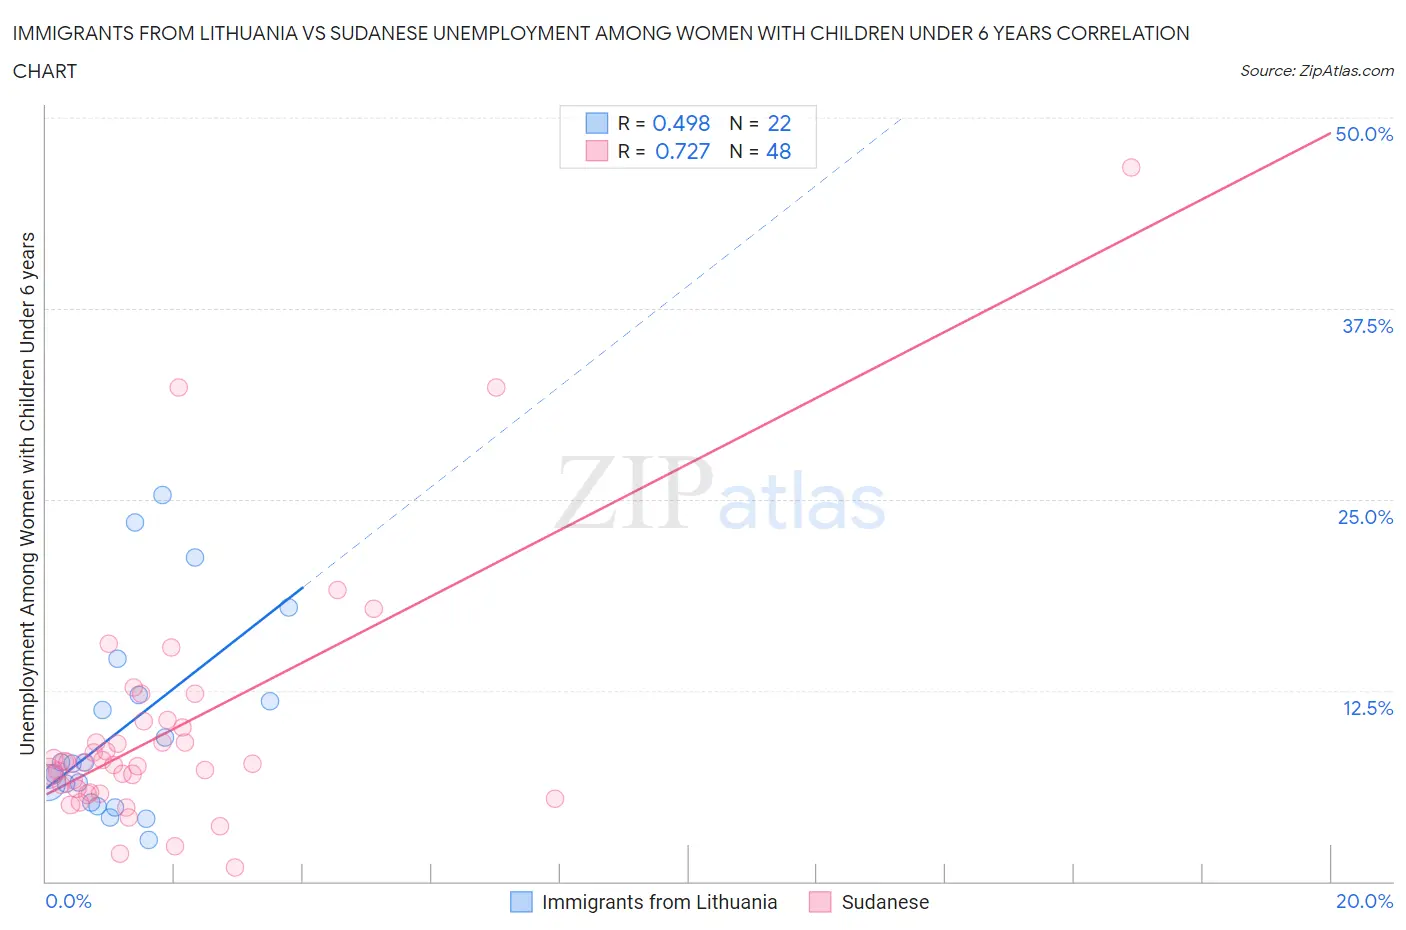
Immigrants from Lithuania vs Sudanese Unemployment Among Women with Children Under 6 years Correlation Chart
The statistical analysis conducted on geographies consisting of 102,015,606 people shows a moderate positive correlation between the proportion of Immigrants from Lithuania and unemployment rate among women with children under the age of 6 in the United States with a correlation coefficient (R) of 0.498 and weighted average of 7.5%. Similarly, the statistical analysis conducted on geographies consisting of 100,483,224 people shows a strong positive correlation between the proportion of Sudanese and unemployment rate among women with children under the age of 6 in the United States with a correlation coefficient (R) of 0.727 and weighted average of 7.8%, a difference of 3.3%.
Unemployment Among Women with Children Under 6 years Correlation Summary
| Measurement | Immigrants from Lithuania | Sudanese |
| Minimum | 2.7% | 0.90% |
| Maximum | 25.3% | 46.7% |
| Range | 22.6% | 45.8% |
| Mean | 10.1% | 9.9% |
| Median | 7.7% | 7.7% |
| Interquartile 25% (IQ1) | 5.2% | 6.0% |
| Interquartile 75% (IQ3) | 12.2% | 10.3% |
| Interquartile Range (IQR) | 7.0% | 4.3% |
| Standard Deviation (Sample) | 6.5% | 8.2% |
| Standard Deviation (Population) | 6.4% | 8.1% |
Similar Demographics by Unemployment Among Women with Children Under 6 years
Demographics Similar to Immigrants from Lithuania by Unemployment Among Women with Children Under 6 years
In terms of unemployment among women with children under 6 years, the demographic groups most similar to Immigrants from Lithuania are Immigrants from Western Asia (7.5%, a difference of 0.12%), Bolivian (7.5%, a difference of 0.16%), British (7.6%, a difference of 0.19%), Immigrants from Philippines (7.5%, a difference of 0.20%), and Ugandan (7.6%, a difference of 0.23%).
| Demographics | Rating | Rank | Unemployment Among Women with Children Under 6 years |
| South Americans | 74.1 /100 | #155 | Good 7.5% |
| Immigrants | Southern Europe | 73.2 /100 | #156 | Good 7.5% |
| Peruvians | 72.3 /100 | #157 | Good 7.5% |
| Croatians | 71.9 /100 | #158 | Good 7.5% |
| Immigrants | Philippines | 71.3 /100 | #159 | Good 7.5% |
| Bolivians | 70.8 /100 | #160 | Good 7.5% |
| Immigrants | Western Asia | 70.2 /100 | #161 | Good 7.5% |
| Immigrants | Lithuania | 68.8 /100 | #162 | Good 7.5% |
| British | 66.3 /100 | #163 | Good 7.6% |
| Ugandans | 65.8 /100 | #164 | Good 7.6% |
| Immigrants | South America | 65.6 /100 | #165 | Good 7.6% |
| Belgians | 63.5 /100 | #166 | Good 7.6% |
| Kenyans | 62.5 /100 | #167 | Good 7.6% |
| Immigrants | Canada | 61.6 /100 | #168 | Good 7.6% |
| Immigrants | Scotland | 61.3 /100 | #169 | Good 7.6% |
Demographics Similar to Sudanese by Unemployment Among Women with Children Under 6 years
In terms of unemployment among women with children under 6 years, the demographic groups most similar to Sudanese are Spaniard (7.8%, a difference of 0.010%), Basque (7.8%, a difference of 0.11%), Lebanese (7.8%, a difference of 0.12%), Guamanian/Chamorro (7.8%, a difference of 0.18%), and Immigrants (7.8%, a difference of 0.20%).
| Demographics | Rating | Rank | Unemployment Among Women with Children Under 6 years |
| Malaysians | 31.1 /100 | #195 | Fair 7.7% |
| Immigrants | St. Vincent and the Grenadines | 31.1 /100 | #196 | Fair 7.7% |
| Italians | 30.4 /100 | #197 | Fair 7.7% |
| Lithuanians | 30.0 /100 | #198 | Fair 7.8% |
| Immigrants | Poland | 27.3 /100 | #199 | Fair 7.8% |
| Guamanians/Chamorros | 25.5 /100 | #200 | Fair 7.8% |
| Basques | 24.7 /100 | #201 | Fair 7.8% |
| Sudanese | 23.5 /100 | #202 | Fair 7.8% |
| Spaniards | 23.3 /100 | #203 | Fair 7.8% |
| Lebanese | 22.2 /100 | #204 | Fair 7.8% |
| Immigrants | Immigrants | 21.4 /100 | #205 | Fair 7.8% |
| Hungarians | 21.2 /100 | #206 | Fair 7.8% |
| Canadians | 20.6 /100 | #207 | Fair 7.8% |
| Immigrants | Syria | 18.9 /100 | #208 | Poor 7.8% |
| Costa Ricans | 17.6 /100 | #209 | Poor 7.8% |