Immigrants from Saudi Arabia vs Sudanese Unemployment Among Women with Children Under 6 years
COMPARE
Immigrants from Saudi Arabia
Sudanese
Unemployment Among Women with Children Under 6 years
Unemployment Among Women with Children Under 6 years Comparison
Immigrants from Saudi Arabia
Sudanese
7.2%
UNEMPLOYMENT AMONG WOMEN WITH CHILDREN UNDER 6 YEARS
97.3/ 100
METRIC RATING
103rd/ 347
METRIC RANK
7.8%
UNEMPLOYMENT AMONG WOMEN WITH CHILDREN UNDER 6 YEARS
23.5/ 100
METRIC RATING
202nd/ 347
METRIC RANK
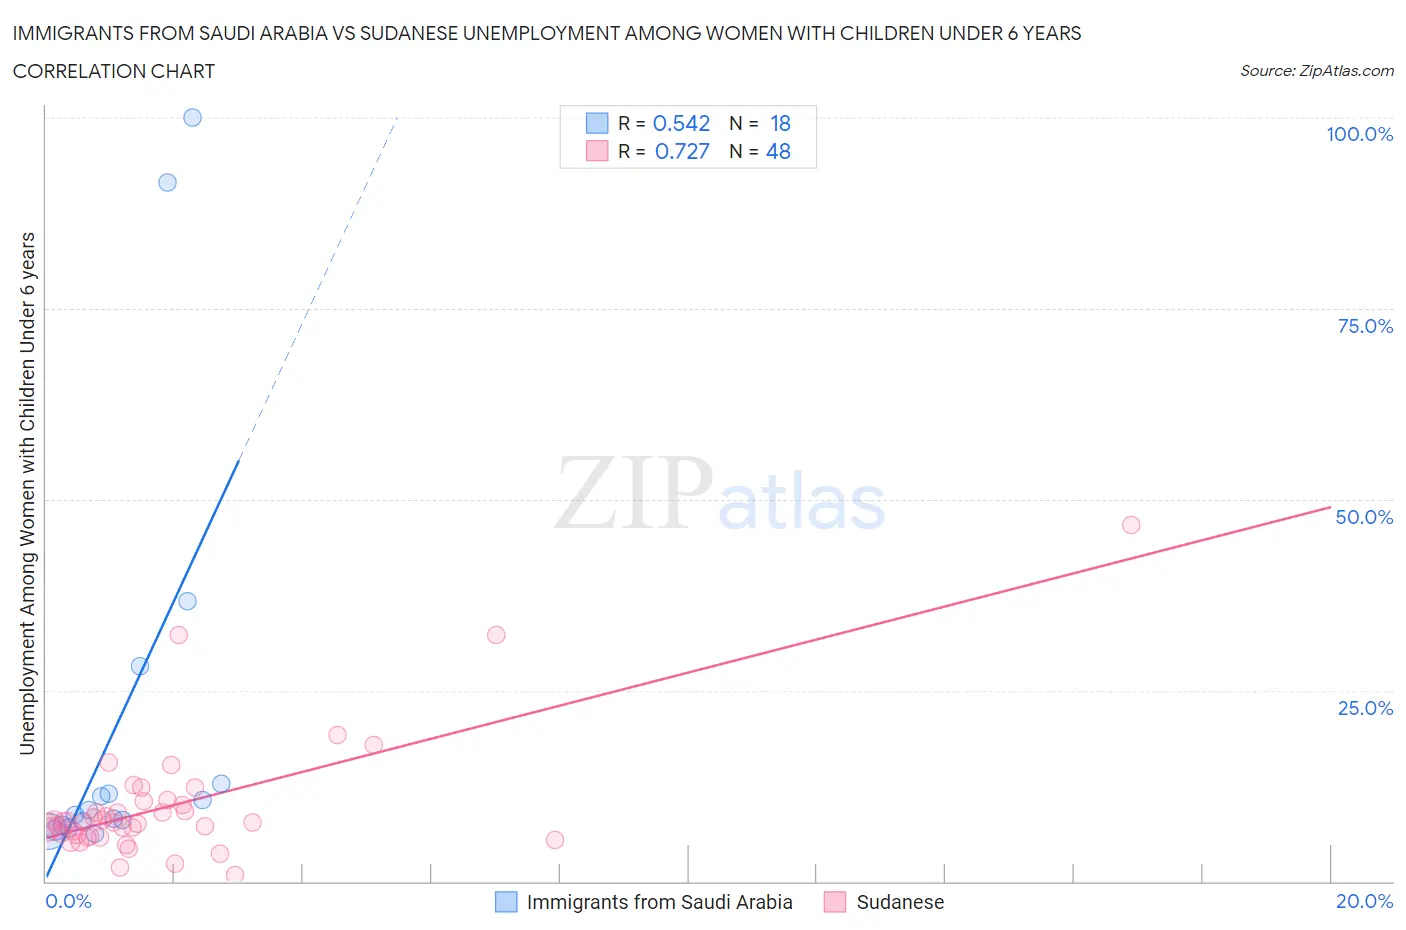
Immigrants from Saudi Arabia vs Sudanese Unemployment Among Women with Children Under 6 years Correlation Chart
The statistical analysis conducted on geographies consisting of 143,989,640 people shows a substantial positive correlation between the proportion of Immigrants from Saudi Arabia and unemployment rate among women with children under the age of 6 in the United States with a correlation coefficient (R) of 0.542 and weighted average of 7.2%. Similarly, the statistical analysis conducted on geographies consisting of 100,483,224 people shows a strong positive correlation between the proportion of Sudanese and unemployment rate among women with children under the age of 6 in the United States with a correlation coefficient (R) of 0.727 and weighted average of 7.8%, a difference of 8.4%.
Unemployment Among Women with Children Under 6 years Correlation Summary
| Measurement | Immigrants from Saudi Arabia | Sudanese |
| Minimum | 6.3% | 0.90% |
| Maximum | 100.0% | 46.7% |
| Range | 93.7% | 45.8% |
| Mean | 21.0% | 9.9% |
| Median | 9.0% | 7.7% |
| Interquartile 25% (IQ1) | 7.3% | 6.0% |
| Interquartile 75% (IQ3) | 12.8% | 10.3% |
| Interquartile Range (IQR) | 5.5% | 4.3% |
| Standard Deviation (Sample) | 28.4% | 8.2% |
| Standard Deviation (Population) | 27.6% | 8.1% |
Similar Demographics by Unemployment Among Women with Children Under 6 years
Demographics Similar to Immigrants from Saudi Arabia by Unemployment Among Women with Children Under 6 years
In terms of unemployment among women with children under 6 years, the demographic groups most similar to Immigrants from Saudi Arabia are Immigrants from Nicaragua (7.2%, a difference of 0.0%), Chilean (7.2%, a difference of 0.030%), Immigrants from Northern Europe (7.2%, a difference of 0.050%), Immigrants from Egypt (7.2%, a difference of 0.080%), and Venezuelan (7.2%, a difference of 0.090%).
| Demographics | Rating | Rank | Unemployment Among Women with Children Under 6 years |
| Immigrants | Eastern Africa | 97.7 /100 | #96 | Exceptional 7.2% |
| Immigrants | South Eastern Asia | 97.6 /100 | #97 | Exceptional 7.2% |
| Russians | 97.5 /100 | #98 | Exceptional 7.2% |
| Immigrants | Europe | 97.5 /100 | #99 | Exceptional 7.2% |
| Immigrants | Northern Europe | 97.4 /100 | #100 | Exceptional 7.2% |
| Chileans | 97.4 /100 | #101 | Exceptional 7.2% |
| Immigrants | Nicaragua | 97.3 /100 | #102 | Exceptional 7.2% |
| Immigrants | Saudi Arabia | 97.3 /100 | #103 | Exceptional 7.2% |
| Immigrants | Egypt | 97.2 /100 | #104 | Exceptional 7.2% |
| Venezuelans | 97.2 /100 | #105 | Exceptional 7.2% |
| Immigrants | Pakistan | 97.2 /100 | #106 | Exceptional 7.2% |
| Immigrants | Kazakhstan | 97.1 /100 | #107 | Exceptional 7.2% |
| Eastern Europeans | 96.9 /100 | #108 | Exceptional 7.2% |
| Australians | 96.9 /100 | #109 | Exceptional 7.2% |
| Palestinians | 96.8 /100 | #110 | Exceptional 7.2% |
Demographics Similar to Sudanese by Unemployment Among Women with Children Under 6 years
In terms of unemployment among women with children under 6 years, the demographic groups most similar to Sudanese are Spaniard (7.8%, a difference of 0.010%), Basque (7.8%, a difference of 0.11%), Lebanese (7.8%, a difference of 0.12%), Guamanian/Chamorro (7.8%, a difference of 0.18%), and Immigrants (7.8%, a difference of 0.20%).
| Demographics | Rating | Rank | Unemployment Among Women with Children Under 6 years |
| Malaysians | 31.1 /100 | #195 | Fair 7.7% |
| Immigrants | St. Vincent and the Grenadines | 31.1 /100 | #196 | Fair 7.7% |
| Italians | 30.4 /100 | #197 | Fair 7.7% |
| Lithuanians | 30.0 /100 | #198 | Fair 7.8% |
| Immigrants | Poland | 27.3 /100 | #199 | Fair 7.8% |
| Guamanians/Chamorros | 25.5 /100 | #200 | Fair 7.8% |
| Basques | 24.7 /100 | #201 | Fair 7.8% |
| Sudanese | 23.5 /100 | #202 | Fair 7.8% |
| Spaniards | 23.3 /100 | #203 | Fair 7.8% |
| Lebanese | 22.2 /100 | #204 | Fair 7.8% |
| Immigrants | Immigrants | 21.4 /100 | #205 | Fair 7.8% |
| Hungarians | 21.2 /100 | #206 | Fair 7.8% |
| Canadians | 20.6 /100 | #207 | Fair 7.8% |
| Immigrants | Syria | 18.9 /100 | #208 | Poor 7.8% |
| Costa Ricans | 17.6 /100 | #209 | Poor 7.8% |