Uruguayan vs Sierra Leonean Unemployment Among Women with Children Ages 6 to 17 years
COMPARE
Uruguayan
Sierra Leonean
Unemployment Among Women with Children Ages 6 to 17 years
Unemployment Among Women with Children Ages 6 to 17 years Comparison
Uruguayans
Sierra Leoneans
9.3%
UNEMPLOYMENT AMONG WOMEN WITH CHILDREN AGES 6 TO 17 YEARS
3.0/ 100
METRIC RATING
235th/ 347
METRIC RANK
9.9%
UNEMPLOYMENT AMONG WOMEN WITH CHILDREN AGES 6 TO 17 YEARS
0.0/ 100
METRIC RATING
287th/ 347
METRIC RANK
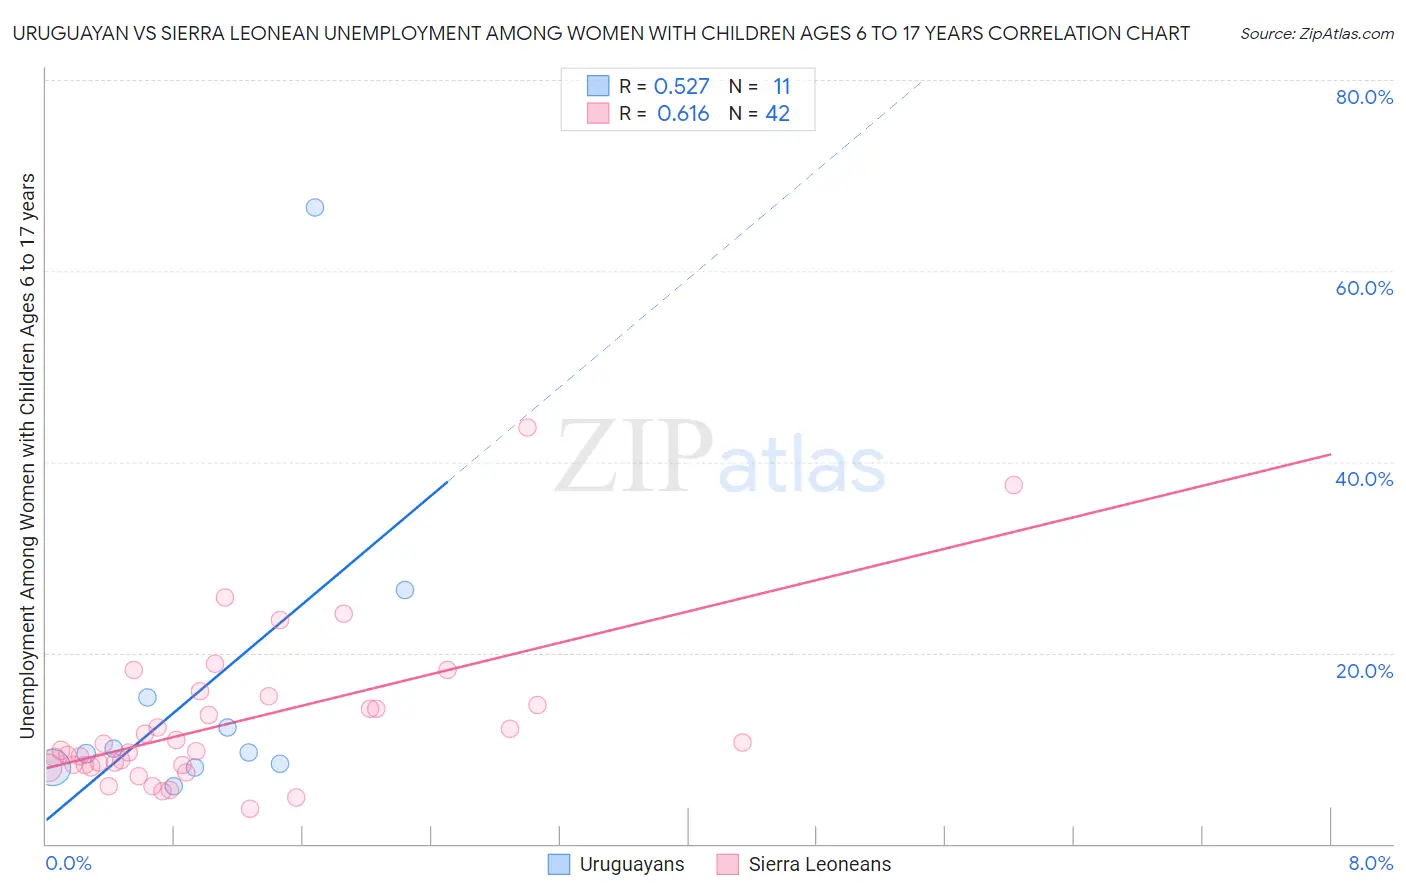
Uruguayan vs Sierra Leonean Unemployment Among Women with Children Ages 6 to 17 years Correlation Chart
The statistical analysis conducted on geographies consisting of 121,055,966 people shows a substantial positive correlation between the proportion of Uruguayans and unemployment rate among women with children between the ages 6 and 17 in the United States with a correlation coefficient (R) of 0.527 and weighted average of 9.3%. Similarly, the statistical analysis conducted on geographies consisting of 75,611,465 people shows a significant positive correlation between the proportion of Sierra Leoneans and unemployment rate among women with children between the ages 6 and 17 in the United States with a correlation coefficient (R) of 0.616 and weighted average of 9.9%, a difference of 6.7%.
Unemployment Among Women with Children Ages 6 to 17 years Correlation Summary
| Measurement | Uruguayan | Sierra Leonean |
| Minimum | 6.0% | 3.7% |
| Maximum | 66.7% | 43.6% |
| Range | 60.6% | 39.9% |
| Mean | 16.4% | 12.7% |
| Median | 9.6% | 9.7% |
| Interquartile 25% (IQ1) | 8.0% | 8.3% |
| Interquartile 75% (IQ3) | 15.4% | 14.5% |
| Interquartile Range (IQR) | 7.4% | 6.2% |
| Standard Deviation (Sample) | 17.6% | 8.2% |
| Standard Deviation (Population) | 16.8% | 8.1% |
Similar Demographics by Unemployment Among Women with Children Ages 6 to 17 years
Demographics Similar to Uruguayans by Unemployment Among Women with Children Ages 6 to 17 years
In terms of unemployment among women with children ages 6 to 17 years, the demographic groups most similar to Uruguayans are Hungarian (9.3%, a difference of 0.030%), Mexican (9.3%, a difference of 0.070%), Immigrants from Belize (9.3%, a difference of 0.070%), Immigrants from St. Vincent and the Grenadines (9.3%, a difference of 0.10%), and Arab (9.3%, a difference of 0.15%).
| Demographics | Rating | Rank | Unemployment Among Women with Children Ages 6 to 17 years |
| Estonians | 4.4 /100 | #228 | Tragic 9.3% |
| Lumbee | 4.3 /100 | #229 | Tragic 9.3% |
| Welsh | 4.0 /100 | #230 | Tragic 9.3% |
| Macedonians | 3.9 /100 | #231 | Tragic 9.3% |
| French American Indians | 3.7 /100 | #232 | Tragic 9.3% |
| Immigrants | St. Vincent and the Grenadines | 3.3 /100 | #233 | Tragic 9.3% |
| Mexicans | 3.2 /100 | #234 | Tragic 9.3% |
| Uruguayans | 3.0 /100 | #235 | Tragic 9.3% |
| Hungarians | 3.0 /100 | #236 | Tragic 9.3% |
| Immigrants | Belize | 2.8 /100 | #237 | Tragic 9.3% |
| Arabs | 2.7 /100 | #238 | Tragic 9.3% |
| Immigrants | Saudi Arabia | 2.7 /100 | #239 | Tragic 9.3% |
| Guatemalans | 2.3 /100 | #240 | Tragic 9.3% |
| Colombians | 2.2 /100 | #241 | Tragic 9.3% |
| Immigrants | Colombia | 2.1 /100 | #242 | Tragic 9.3% |
Demographics Similar to Sierra Leoneans by Unemployment Among Women with Children Ages 6 to 17 years
In terms of unemployment among women with children ages 6 to 17 years, the demographic groups most similar to Sierra Leoneans are Choctaw (9.9%, a difference of 0.050%), Hispanic or Latino (9.9%, a difference of 0.16%), Shoshone (10.0%, a difference of 0.24%), Yakama (9.9%, a difference of 0.47%), and Central American Indian (9.9%, a difference of 0.63%).
| Demographics | Rating | Rank | Unemployment Among Women with Children Ages 6 to 17 years |
| Seminole | 0.1 /100 | #280 | Tragic 9.7% |
| Jamaicans | 0.0 /100 | #281 | Tragic 9.8% |
| Slovaks | 0.0 /100 | #282 | Tragic 9.8% |
| Central American Indians | 0.0 /100 | #283 | Tragic 9.9% |
| Yakama | 0.0 /100 | #284 | Tragic 9.9% |
| Hispanics or Latinos | 0.0 /100 | #285 | Tragic 9.9% |
| Choctaw | 0.0 /100 | #286 | Tragic 9.9% |
| Sierra Leoneans | 0.0 /100 | #287 | Tragic 9.9% |
| Shoshone | 0.0 /100 | #288 | Tragic 10.0% |
| Hondurans | 0.0 /100 | #289 | Tragic 10.0% |
| Sub-Saharan Africans | 0.0 /100 | #290 | Tragic 10.0% |
| Immigrants | Nonimmigrants | 0.0 /100 | #291 | Tragic 10.0% |
| Carpatho Rusyns | 0.0 /100 | #292 | Tragic 10.0% |
| Haitians | 0.0 /100 | #293 | Tragic 10.0% |
| Ecuadorians | 0.0 /100 | #294 | Tragic 10.0% |