Ukrainian vs Asian Unemployment Among Women with Children Ages 6 to 17 years
COMPARE
Ukrainian
Asian
Unemployment Among Women with Children Ages 6 to 17 years
Unemployment Among Women with Children Ages 6 to 17 years Comparison
Ukrainians
Asians
8.9%
UNEMPLOYMENT AMONG WOMEN WITH CHILDREN AGES 6 TO 17 YEARS
59.7/ 100
METRIC RATING
164th/ 347
METRIC RANK
8.0%
UNEMPLOYMENT AMONG WOMEN WITH CHILDREN AGES 6 TO 17 YEARS
100.0/ 100
METRIC RATING
37th/ 347
METRIC RANK
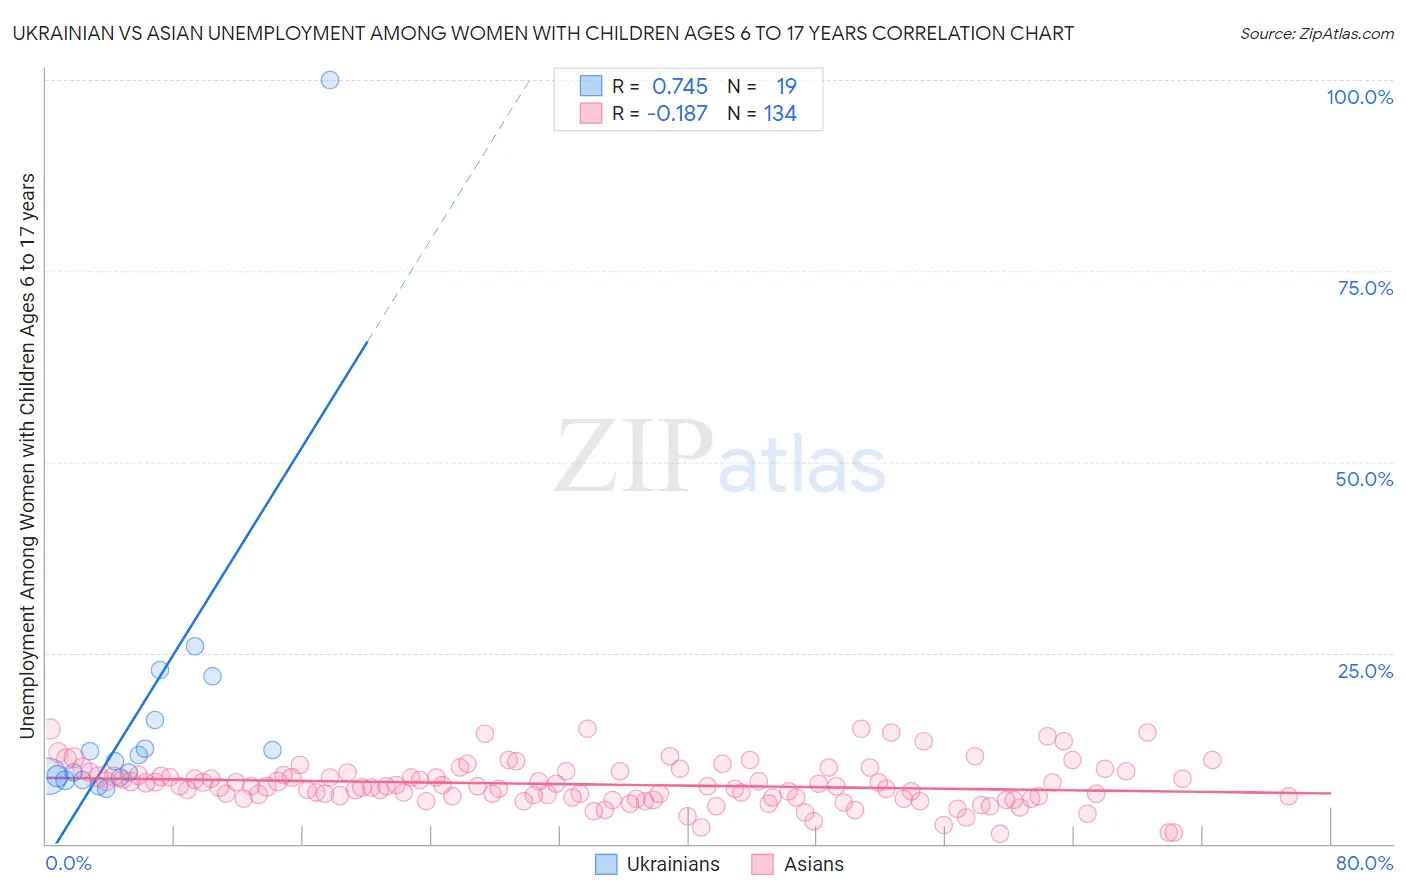
Ukrainian vs Asian Unemployment Among Women with Children Ages 6 to 17 years Correlation Chart
The statistical analysis conducted on geographies consisting of 304,599,225 people shows a strong positive correlation between the proportion of Ukrainians and unemployment rate among women with children between the ages 6 and 17 in the United States with a correlation coefficient (R) of 0.745 and weighted average of 8.9%. Similarly, the statistical analysis conducted on geographies consisting of 355,293,130 people shows a poor negative correlation between the proportion of Asians and unemployment rate among women with children between the ages 6 and 17 in the United States with a correlation coefficient (R) of -0.187 and weighted average of 8.0%, a difference of 12.1%.
Unemployment Among Women with Children Ages 6 to 17 years Correlation Summary
| Measurement | Ukrainian | Asian |
| Minimum | 7.2% | 1.3% |
| Maximum | 100.0% | 15.1% |
| Range | 92.8% | 13.8% |
| Mean | 17.0% | 7.8% |
| Median | 10.8% | 7.5% |
| Interquartile 25% (IQ1) | 8.7% | 6.0% |
| Interquartile 75% (IQ3) | 16.3% | 9.0% |
| Interquartile Range (IQR) | 7.6% | 2.9% |
| Standard Deviation (Sample) | 20.8% | 2.8% |
| Standard Deviation (Population) | 20.3% | 2.8% |
Similar Demographics by Unemployment Among Women with Children Ages 6 to 17 years
Demographics Similar to Ukrainians by Unemployment Among Women with Children Ages 6 to 17 years
In terms of unemployment among women with children ages 6 to 17 years, the demographic groups most similar to Ukrainians are Immigrants from Micronesia (8.9%, a difference of 0.020%), Mexican American Indian (8.9%, a difference of 0.040%), Immigrants from Netherlands (8.9%, a difference of 0.050%), Moroccan (8.9%, a difference of 0.060%), and Immigrants from England (8.9%, a difference of 0.090%).
| Demographics | Rating | Rank | Unemployment Among Women with Children Ages 6 to 17 years |
| Immigrants | Belgium | 65.6 /100 | #157 | Good 8.9% |
| Immigrants | Chile | 65.3 /100 | #158 | Good 8.9% |
| Spanish | 63.8 /100 | #159 | Good 8.9% |
| Immigrants | Hungary | 63.4 /100 | #160 | Good 8.9% |
| Immigrants | Guyana | 63.0 /100 | #161 | Good 8.9% |
| Immigrants | Netherlands | 60.8 /100 | #162 | Good 8.9% |
| Mexican American Indians | 60.6 /100 | #163 | Good 8.9% |
| Ukrainians | 59.7 /100 | #164 | Average 8.9% |
| Immigrants | Micronesia | 59.2 /100 | #165 | Average 8.9% |
| Moroccans | 58.3 /100 | #166 | Average 8.9% |
| Immigrants | England | 57.7 /100 | #167 | Average 8.9% |
| Immigrants | Croatia | 57.1 /100 | #168 | Average 8.9% |
| British | 55.2 /100 | #169 | Average 8.9% |
| Turks | 54.1 /100 | #170 | Average 8.9% |
| Jordanians | 52.2 /100 | #171 | Average 9.0% |
Demographics Similar to Asians by Unemployment Among Women with Children Ages 6 to 17 years
In terms of unemployment among women with children ages 6 to 17 years, the demographic groups most similar to Asians are Burmese (8.0%, a difference of 0.030%), Immigrants from South Central Asia (7.9%, a difference of 0.11%), Native Hawaiian (7.9%, a difference of 0.22%), Alsatian (8.0%, a difference of 0.33%), and Somali (8.0%, a difference of 0.47%).
| Demographics | Rating | Rank | Unemployment Among Women with Children Ages 6 to 17 years |
| Immigrants | Iran | 100.0 /100 | #30 | Exceptional 7.9% |
| Laotians | 100.0 /100 | #31 | Exceptional 7.9% |
| Immigrants | Cambodia | 100.0 /100 | #32 | Exceptional 7.9% |
| Immigrants | Korea | 100.0 /100 | #33 | Exceptional 7.9% |
| Native Hawaiians | 100.0 /100 | #34 | Exceptional 7.9% |
| Immigrants | South Central Asia | 100.0 /100 | #35 | Exceptional 7.9% |
| Burmese | 100.0 /100 | #36 | Exceptional 8.0% |
| Asians | 100.0 /100 | #37 | Exceptional 8.0% |
| Alsatians | 100.0 /100 | #38 | Exceptional 8.0% |
| Somalis | 100.0 /100 | #39 | Exceptional 8.0% |
| Immigrants | Zimbabwe | 100.0 /100 | #40 | Exceptional 8.0% |
| Iranians | 100.0 /100 | #41 | Exceptional 8.0% |
| Immigrants | Somalia | 100.0 /100 | #42 | Exceptional 8.0% |
| Bhutanese | 100.0 /100 | #43 | Exceptional 8.1% |
| Immigrants | Sweden | 100.0 /100 | #44 | Exceptional 8.1% |