Ukrainian vs Immigrants from Latin America Unemployment Among Women with Children Ages 6 to 17 years
COMPARE
Ukrainian
Immigrants from Latin America
Unemployment Among Women with Children Ages 6 to 17 years
Unemployment Among Women with Children Ages 6 to 17 years Comparison
Ukrainians
Immigrants from Latin America
8.9%
UNEMPLOYMENT AMONG WOMEN WITH CHILDREN AGES 6 TO 17 YEARS
59.7/ 100
METRIC RATING
164th/ 347
METRIC RANK
9.6%
UNEMPLOYMENT AMONG WOMEN WITH CHILDREN AGES 6 TO 17 YEARS
0.1/ 100
METRIC RATING
271st/ 347
METRIC RANK
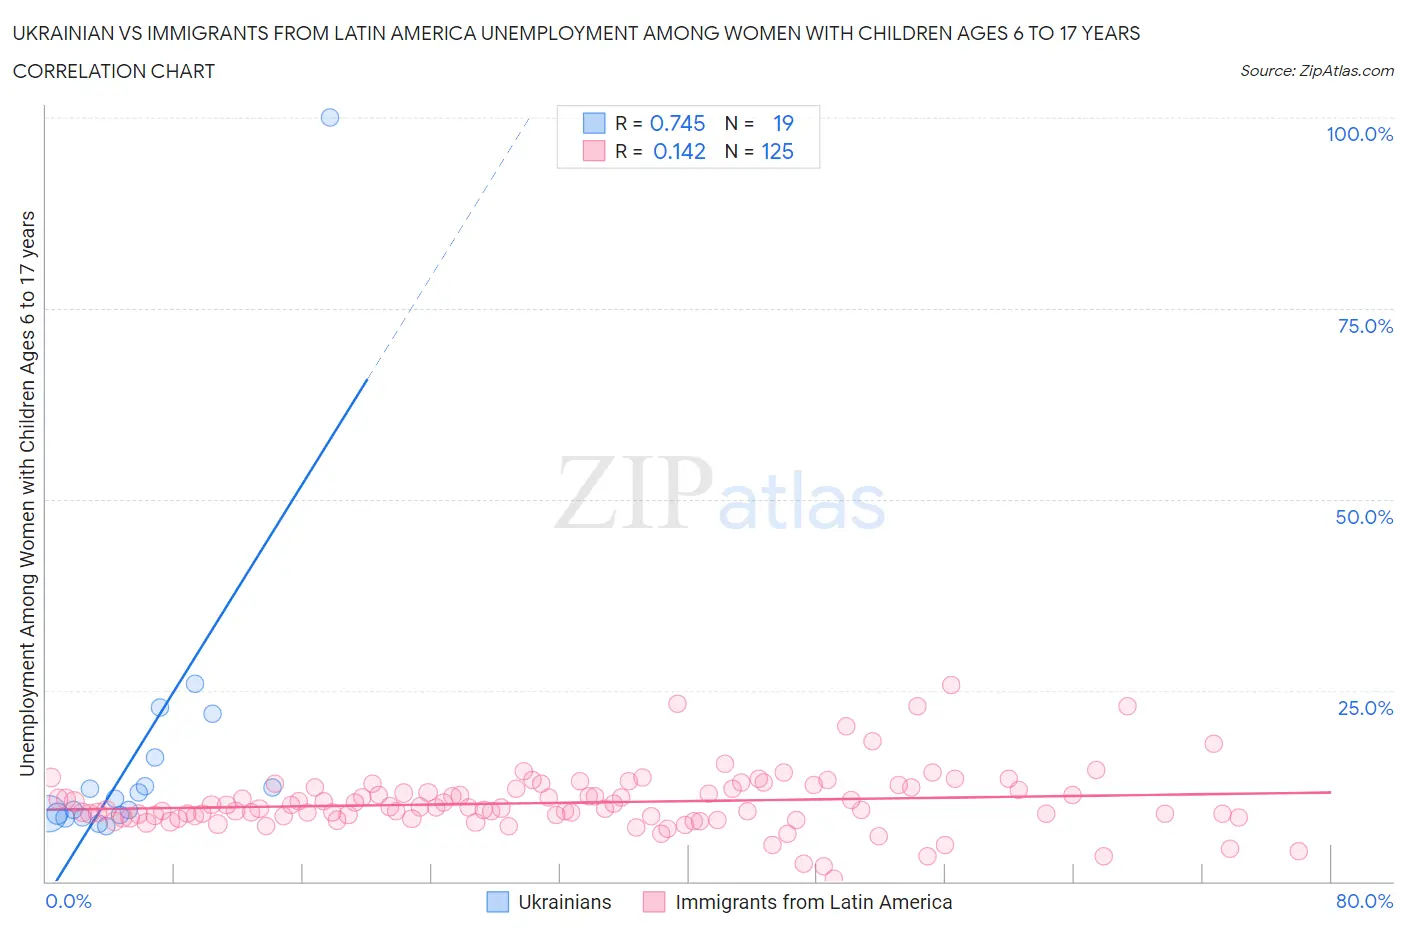
Ukrainian vs Immigrants from Latin America Unemployment Among Women with Children Ages 6 to 17 years Correlation Chart
The statistical analysis conducted on geographies consisting of 304,599,225 people shows a strong positive correlation between the proportion of Ukrainians and unemployment rate among women with children between the ages 6 and 17 in the United States with a correlation coefficient (R) of 0.745 and weighted average of 8.9%. Similarly, the statistical analysis conducted on geographies consisting of 357,703,345 people shows a poor positive correlation between the proportion of Immigrants from Latin America and unemployment rate among women with children between the ages 6 and 17 in the United States with a correlation coefficient (R) of 0.142 and weighted average of 9.6%, a difference of 7.9%.
Unemployment Among Women with Children Ages 6 to 17 years Correlation Summary
| Measurement | Ukrainian | Immigrants from Latin America |
| Minimum | 7.2% | 0.30% |
| Maximum | 100.0% | 25.7% |
| Range | 92.8% | 25.4% |
| Mean | 17.0% | 10.3% |
| Median | 10.8% | 9.6% |
| Interquartile 25% (IQ1) | 8.7% | 8.4% |
| Interquartile 75% (IQ3) | 16.3% | 12.1% |
| Interquartile Range (IQR) | 7.6% | 3.7% |
| Standard Deviation (Sample) | 20.8% | 3.9% |
| Standard Deviation (Population) | 20.3% | 3.9% |
Similar Demographics by Unemployment Among Women with Children Ages 6 to 17 years
Demographics Similar to Ukrainians by Unemployment Among Women with Children Ages 6 to 17 years
In terms of unemployment among women with children ages 6 to 17 years, the demographic groups most similar to Ukrainians are Immigrants from Micronesia (8.9%, a difference of 0.020%), Mexican American Indian (8.9%, a difference of 0.040%), Immigrants from Netherlands (8.9%, a difference of 0.050%), Moroccan (8.9%, a difference of 0.060%), and Immigrants from England (8.9%, a difference of 0.090%).
| Demographics | Rating | Rank | Unemployment Among Women with Children Ages 6 to 17 years |
| Immigrants | Belgium | 65.6 /100 | #157 | Good 8.9% |
| Immigrants | Chile | 65.3 /100 | #158 | Good 8.9% |
| Spanish | 63.8 /100 | #159 | Good 8.9% |
| Immigrants | Hungary | 63.4 /100 | #160 | Good 8.9% |
| Immigrants | Guyana | 63.0 /100 | #161 | Good 8.9% |
| Immigrants | Netherlands | 60.8 /100 | #162 | Good 8.9% |
| Mexican American Indians | 60.6 /100 | #163 | Good 8.9% |
| Ukrainians | 59.7 /100 | #164 | Average 8.9% |
| Immigrants | Micronesia | 59.2 /100 | #165 | Average 8.9% |
| Moroccans | 58.3 /100 | #166 | Average 8.9% |
| Immigrants | England | 57.7 /100 | #167 | Average 8.9% |
| Immigrants | Croatia | 57.1 /100 | #168 | Average 8.9% |
| British | 55.2 /100 | #169 | Average 8.9% |
| Turks | 54.1 /100 | #170 | Average 8.9% |
| Jordanians | 52.2 /100 | #171 | Average 9.0% |
Demographics Similar to Immigrants from Latin America by Unemployment Among Women with Children Ages 6 to 17 years
In terms of unemployment among women with children ages 6 to 17 years, the demographic groups most similar to Immigrants from Latin America are Kiowa (9.6%, a difference of 0.060%), White/Caucasian (9.6%, a difference of 0.070%), Aleut (9.6%, a difference of 0.12%), Immigrants from Nicaragua (9.6%, a difference of 0.40%), and Blackfeet (9.6%, a difference of 0.50%).
| Demographics | Rating | Rank | Unemployment Among Women with Children Ages 6 to 17 years |
| Immigrants | Ghana | 0.4 /100 | #264 | Tragic 9.5% |
| West Indians | 0.4 /100 | #265 | Tragic 9.5% |
| Immigrants | Jamaica | 0.3 /100 | #266 | Tragic 9.5% |
| Irish | 0.3 /100 | #267 | Tragic 9.5% |
| Ghanaians | 0.2 /100 | #268 | Tragic 9.6% |
| Blackfeet | 0.2 /100 | #269 | Tragic 9.6% |
| Immigrants | Nicaragua | 0.2 /100 | #270 | Tragic 9.6% |
| Immigrants | Latin America | 0.1 /100 | #271 | Tragic 9.6% |
| Kiowa | 0.1 /100 | #272 | Tragic 9.6% |
| Whites/Caucasians | 0.1 /100 | #273 | Tragic 9.6% |
| Aleuts | 0.1 /100 | #274 | Tragic 9.6% |
| U.S. Virgin Islanders | 0.1 /100 | #275 | Tragic 9.7% |
| Immigrants | Portugal | 0.1 /100 | #276 | Tragic 9.7% |
| British West Indians | 0.1 /100 | #277 | Tragic 9.7% |
| French | 0.1 /100 | #278 | Tragic 9.7% |