Ugandan vs German Russian Male Unemployment
COMPARE
Ugandan
German Russian
Male Unemployment
Male Unemployment Comparison
Ugandans
German Russians
5.5%
MALE UNEMPLOYMENT
6.3/ 100
METRIC RATING
213th/ 347
METRIC RANK
5.1%
MALE UNEMPLOYMENT
92.7/ 100
METRIC RATING
101st/ 347
METRIC RANK
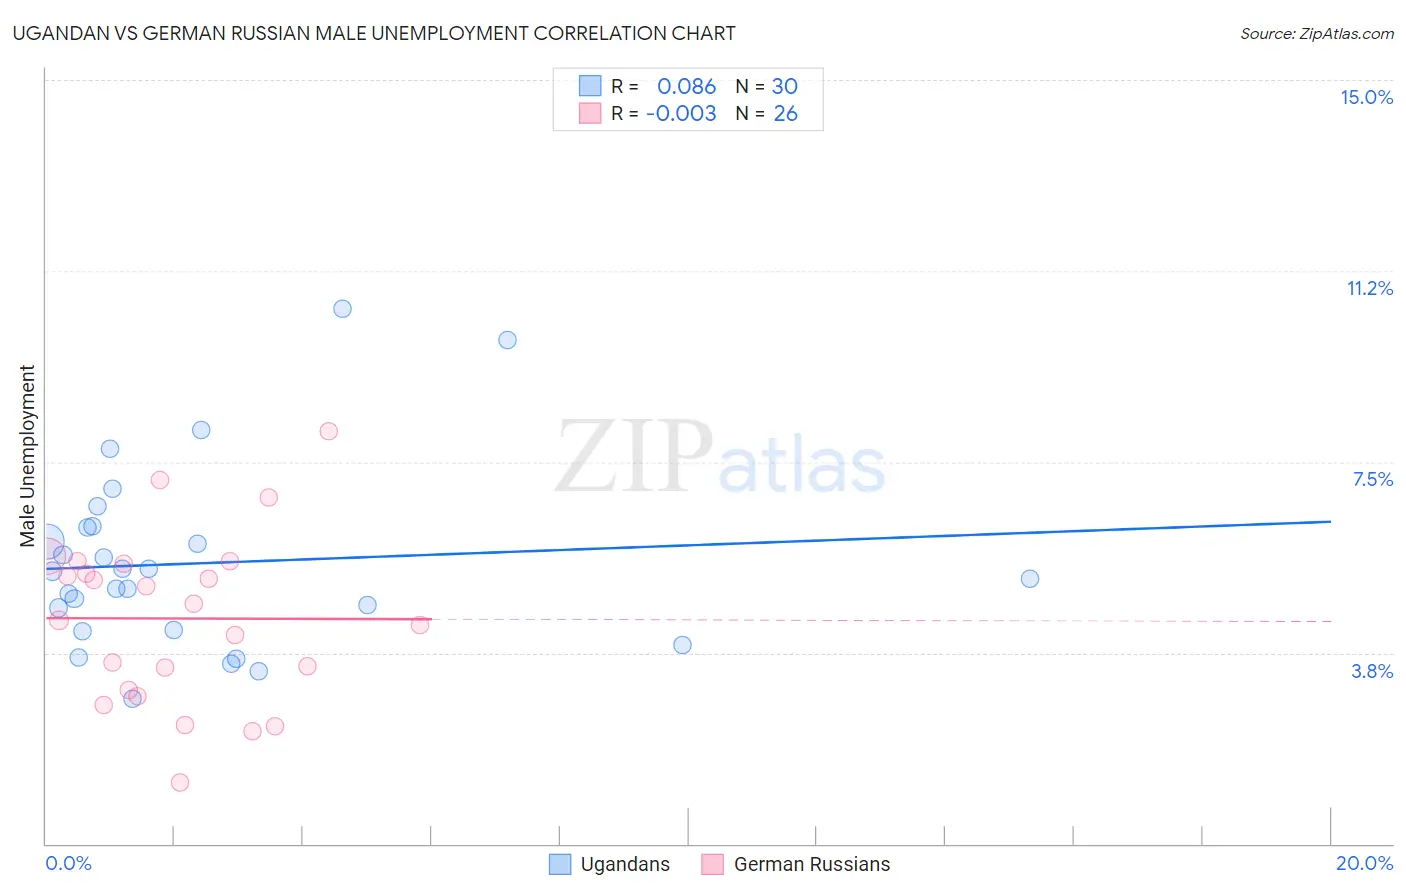
Ugandan vs German Russian Male Unemployment Correlation Chart
The statistical analysis conducted on geographies consisting of 93,962,786 people shows a slight positive correlation between the proportion of Ugandans and unemployment rate among males in the United States with a correlation coefficient (R) of 0.086 and weighted average of 5.5%. Similarly, the statistical analysis conducted on geographies consisting of 96,273,571 people shows no correlation between the proportion of German Russians and unemployment rate among males in the United States with a correlation coefficient (R) of -0.003 and weighted average of 5.1%, a difference of 8.0%.
Male Unemployment Correlation Summary
| Measurement | Ugandan | German Russian |
| Minimum | 2.8% | 1.2% |
| Maximum | 10.5% | 8.1% |
| Range | 7.7% | 6.9% |
| Mean | 5.5% | 4.4% |
| Median | 5.3% | 4.6% |
| Interquartile 25% (IQ1) | 4.2% | 3.0% |
| Interquartile 75% (IQ3) | 6.2% | 5.5% |
| Interquartile Range (IQR) | 2.0% | 2.5% |
| Standard Deviation (Sample) | 1.8% | 1.7% |
| Standard Deviation (Population) | 1.8% | 1.6% |
Similar Demographics by Male Unemployment
Demographics Similar to Ugandans by Male Unemployment
In terms of male unemployment, the demographic groups most similar to Ugandans are Hmong (5.5%, a difference of 0.16%), Puget Sound Salish (5.5%, a difference of 0.17%), Israeli (5.5%, a difference of 0.25%), South American Indian (5.5%, a difference of 0.30%), and Samoan (5.5%, a difference of 0.37%).
| Demographics | Rating | Rank | Male Unemployment |
| Immigrants | Ukraine | 9.9 /100 | #206 | Tragic 5.5% |
| Immigrants | Syria | 9.3 /100 | #207 | Tragic 5.5% |
| Immigrants | Lebanon | 8.6 /100 | #208 | Tragic 5.5% |
| Immigrants | Middle Africa | 8.3 /100 | #209 | Tragic 5.5% |
| South American Indians | 7.6 /100 | #210 | Tragic 5.5% |
| Israelis | 7.4 /100 | #211 | Tragic 5.5% |
| Hmong | 7.0 /100 | #212 | Tragic 5.5% |
| Ugandans | 6.3 /100 | #213 | Tragic 5.5% |
| Puget Sound Salish | 5.6 /100 | #214 | Tragic 5.5% |
| Samoans | 4.9 /100 | #215 | Tragic 5.5% |
| Immigrants | Immigrants | 4.3 /100 | #216 | Tragic 5.5% |
| Delaware | 4.2 /100 | #217 | Tragic 5.5% |
| Immigrants | Albania | 3.6 /100 | #218 | Tragic 5.5% |
| Immigrants | Western Asia | 3.5 /100 | #219 | Tragic 5.6% |
| Portuguese | 3.5 /100 | #220 | Tragic 5.6% |
Demographics Similar to German Russians by Male Unemployment
In terms of male unemployment, the demographic groups most similar to German Russians are Immigrants from France (5.1%, a difference of 0.020%), Russian (5.1%, a difference of 0.040%), Uruguayan (5.1%, a difference of 0.060%), Immigrants from Kuwait (5.1%, a difference of 0.12%), and Immigrants from Spain (5.1%, a difference of 0.16%).
| Demographics | Rating | Rank | Male Unemployment |
| Canadians | 94.1 /100 | #94 | Exceptional 5.1% |
| Italians | 93.8 /100 | #95 | Exceptional 5.1% |
| Asians | 93.7 /100 | #96 | Exceptional 5.1% |
| Immigrants | Spain | 93.4 /100 | #97 | Exceptional 5.1% |
| Immigrants | Kuwait | 93.3 /100 | #98 | Exceptional 5.1% |
| Uruguayans | 93.0 /100 | #99 | Exceptional 5.1% |
| Russians | 92.9 /100 | #100 | Exceptional 5.1% |
| German Russians | 92.7 /100 | #101 | Exceptional 5.1% |
| Immigrants | France | 92.7 /100 | #102 | Exceptional 5.1% |
| Immigrants | Jordan | 91.9 /100 | #103 | Exceptional 5.1% |
| Immigrants | Chile | 91.8 /100 | #104 | Exceptional 5.1% |
| Immigrants | Czechoslovakia | 91.7 /100 | #105 | Exceptional 5.1% |
| Immigrants | Ethiopia | 91.5 /100 | #106 | Exceptional 5.1% |
| Ethiopians | 91.3 /100 | #107 | Exceptional 5.1% |
| Immigrants | Nicaragua | 91.2 /100 | #108 | Exceptional 5.1% |