Guatemalan vs German Russian Male Unemployment
COMPARE
Guatemalan
German Russian
Male Unemployment
Male Unemployment Comparison
Guatemalans
German Russians
5.6%
MALE UNEMPLOYMENT
1.2/ 100
METRIC RATING
236th/ 347
METRIC RANK
5.1%
MALE UNEMPLOYMENT
92.7/ 100
METRIC RATING
101st/ 347
METRIC RANK
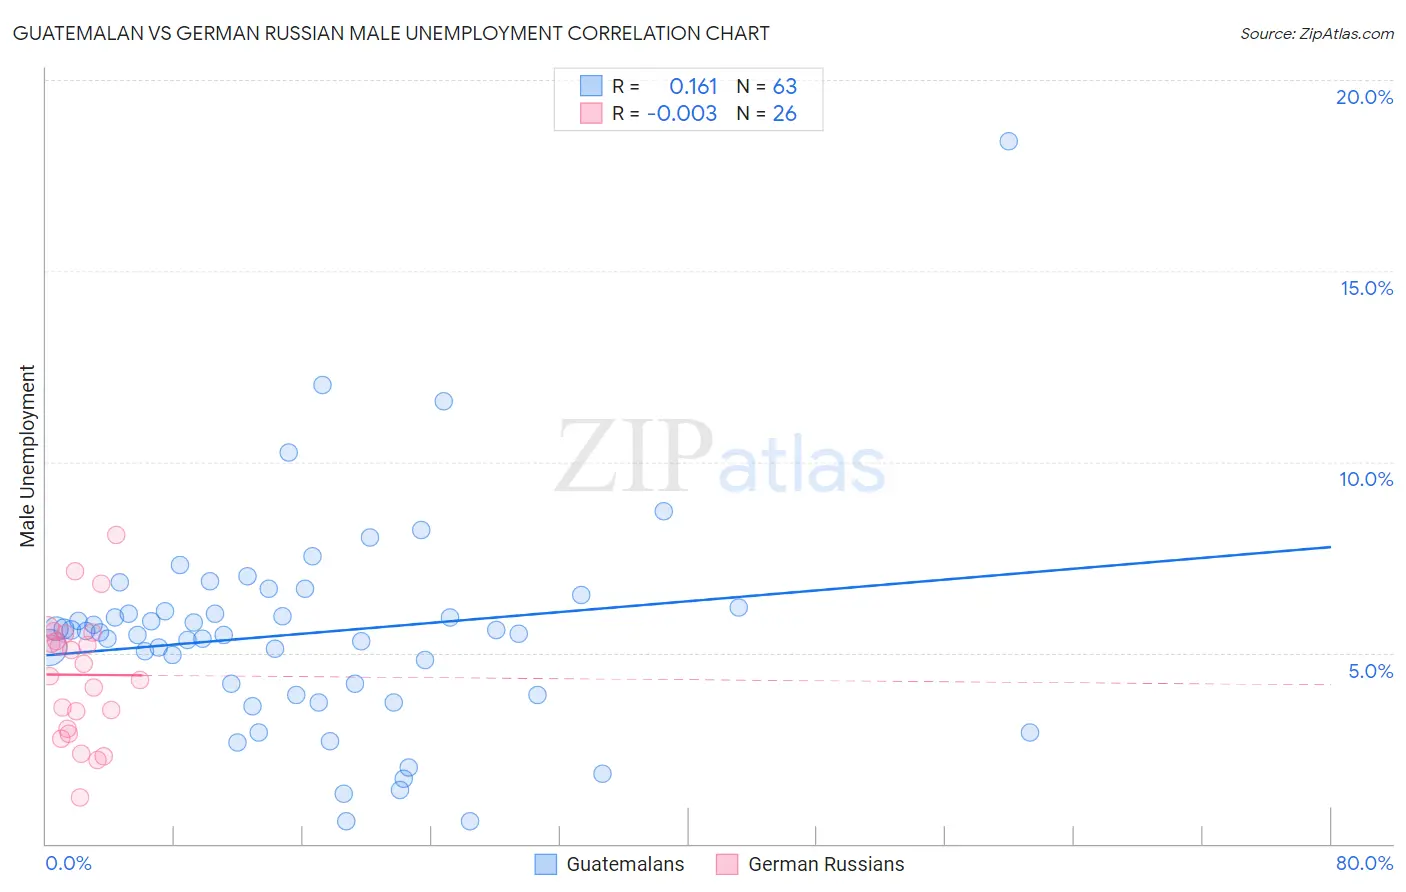
Guatemalan vs German Russian Male Unemployment Correlation Chart
The statistical analysis conducted on geographies consisting of 407,851,547 people shows a poor positive correlation between the proportion of Guatemalans and unemployment rate among males in the United States with a correlation coefficient (R) of 0.161 and weighted average of 5.6%. Similarly, the statistical analysis conducted on geographies consisting of 96,273,571 people shows no correlation between the proportion of German Russians and unemployment rate among males in the United States with a correlation coefficient (R) of -0.003 and weighted average of 5.1%, a difference of 10.6%.
Male Unemployment Correlation Summary
| Measurement | Guatemalan | German Russian |
| Minimum | 0.60% | 1.2% |
| Maximum | 18.4% | 8.1% |
| Range | 17.8% | 6.9% |
| Mean | 5.5% | 4.4% |
| Median | 5.5% | 4.6% |
| Interquartile 25% (IQ1) | 3.9% | 3.0% |
| Interquartile 75% (IQ3) | 6.2% | 5.5% |
| Interquartile Range (IQR) | 2.3% | 2.5% |
| Standard Deviation (Sample) | 2.8% | 1.7% |
| Standard Deviation (Population) | 2.8% | 1.6% |
Similar Demographics by Male Unemployment
Demographics Similar to Guatemalans by Male Unemployment
In terms of male unemployment, the demographic groups most similar to Guatemalans are Honduran (5.6%, a difference of 0.090%), Native Hawaiian (5.6%, a difference of 0.14%), Immigrants from Guatemala (5.6%, a difference of 0.14%), Immigrants from Cameroon (5.6%, a difference of 0.21%), and Salvadoran (5.7%, a difference of 0.25%).
| Demographics | Rating | Rank | Male Unemployment |
| Central Americans | 1.8 /100 | #229 | Tragic 5.6% |
| Immigrants | Africa | 1.7 /100 | #230 | Tragic 5.6% |
| Choctaw | 1.6 /100 | #231 | Tragic 5.6% |
| Moroccans | 1.6 /100 | #232 | Tragic 5.6% |
| Somalis | 1.5 /100 | #233 | Tragic 5.6% |
| Immigrants | Somalia | 1.5 /100 | #234 | Tragic 5.6% |
| Immigrants | Honduras | 1.5 /100 | #235 | Tragic 5.6% |
| Guatemalans | 1.2 /100 | #236 | Tragic 5.6% |
| Hondurans | 1.1 /100 | #237 | Tragic 5.6% |
| Native Hawaiians | 1.1 /100 | #238 | Tragic 5.6% |
| Immigrants | Guatemala | 1.1 /100 | #239 | Tragic 5.6% |
| Immigrants | Cameroon | 1.0 /100 | #240 | Tragic 5.6% |
| Salvadorans | 1.0 /100 | #241 | Tragic 5.7% |
| Ottawa | 0.9 /100 | #242 | Tragic 5.7% |
| Bangladeshis | 0.8 /100 | #243 | Tragic 5.7% |
Demographics Similar to German Russians by Male Unemployment
In terms of male unemployment, the demographic groups most similar to German Russians are Immigrants from France (5.1%, a difference of 0.020%), Russian (5.1%, a difference of 0.040%), Uruguayan (5.1%, a difference of 0.060%), Immigrants from Kuwait (5.1%, a difference of 0.12%), and Immigrants from Spain (5.1%, a difference of 0.16%).
| Demographics | Rating | Rank | Male Unemployment |
| Canadians | 94.1 /100 | #94 | Exceptional 5.1% |
| Italians | 93.8 /100 | #95 | Exceptional 5.1% |
| Asians | 93.7 /100 | #96 | Exceptional 5.1% |
| Immigrants | Spain | 93.4 /100 | #97 | Exceptional 5.1% |
| Immigrants | Kuwait | 93.3 /100 | #98 | Exceptional 5.1% |
| Uruguayans | 93.0 /100 | #99 | Exceptional 5.1% |
| Russians | 92.9 /100 | #100 | Exceptional 5.1% |
| German Russians | 92.7 /100 | #101 | Exceptional 5.1% |
| Immigrants | France | 92.7 /100 | #102 | Exceptional 5.1% |
| Immigrants | Jordan | 91.9 /100 | #103 | Exceptional 5.1% |
| Immigrants | Chile | 91.8 /100 | #104 | Exceptional 5.1% |
| Immigrants | Czechoslovakia | 91.7 /100 | #105 | Exceptional 5.1% |
| Immigrants | Ethiopia | 91.5 /100 | #106 | Exceptional 5.1% |
| Ethiopians | 91.3 /100 | #107 | Exceptional 5.1% |
| Immigrants | Nicaragua | 91.2 /100 | #108 | Exceptional 5.1% |