Tongan vs Ethiopian Unemployment Among Ages 20 to 24 years
COMPARE
Tongan
Ethiopian
Unemployment Among Ages 20 to 24 years
Unemployment Among Ages 20 to 24 years Comparison
Tongans
Ethiopians
9.4%
UNEMPLOYMENT AMONG AGES 20 TO 24 YEARS
100.0/ 100
METRIC RATING
22nd/ 347
METRIC RANK
9.8%
UNEMPLOYMENT AMONG AGES 20 TO 24 YEARS
99.7/ 100
METRIC RATING
51st/ 347
METRIC RANK
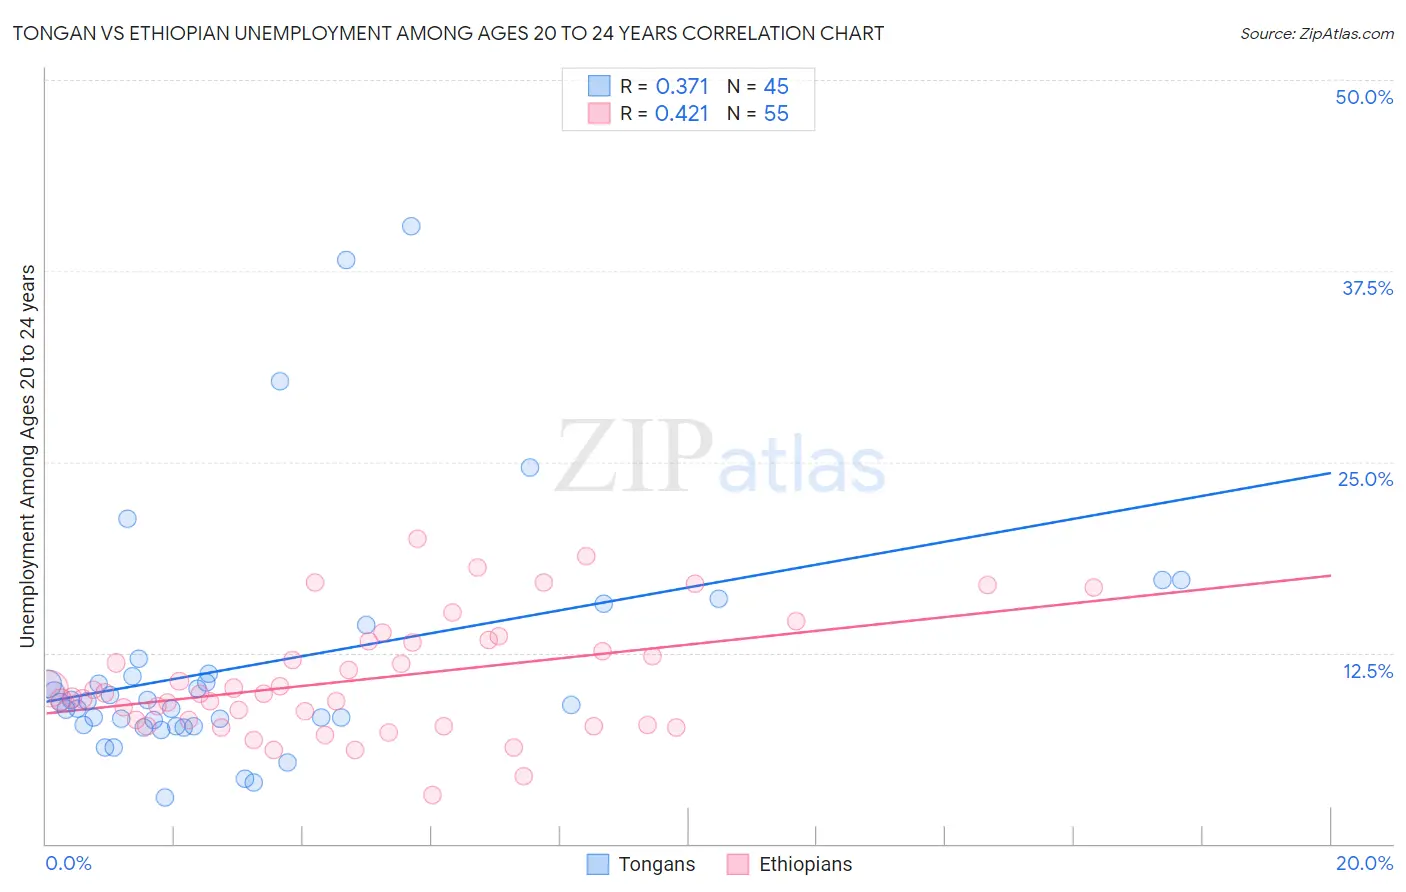
Tongan vs Ethiopian Unemployment Among Ages 20 to 24 years Correlation Chart
The statistical analysis conducted on geographies consisting of 101,940,132 people shows a mild positive correlation between the proportion of Tongans and unemployment rate among population between the ages 20 and 24 in the United States with a correlation coefficient (R) of 0.371 and weighted average of 9.4%. Similarly, the statistical analysis conducted on geographies consisting of 220,623,772 people shows a moderate positive correlation between the proportion of Ethiopians and unemployment rate among population between the ages 20 and 24 in the United States with a correlation coefficient (R) of 0.421 and weighted average of 9.8%, a difference of 3.7%.
Unemployment Among Ages 20 to 24 years Correlation Summary
| Measurement | Tongan | Ethiopian |
| Minimum | 3.0% | 3.2% |
| Maximum | 40.4% | 20.0% |
| Range | 37.4% | 16.8% |
| Mean | 11.7% | 10.8% |
| Median | 9.3% | 9.8% |
| Interquartile 25% (IQ1) | 7.7% | 7.8% |
| Interquartile 75% (IQ3) | 11.6% | 13.3% |
| Interquartile Range (IQR) | 3.8% | 5.5% |
| Standard Deviation (Sample) | 7.9% | 3.8% |
| Standard Deviation (Population) | 7.8% | 3.8% |
Similar Demographics by Unemployment Among Ages 20 to 24 years
Demographics Similar to Tongans by Unemployment Among Ages 20 to 24 years
In terms of unemployment among ages 20 to 24 years, the demographic groups most similar to Tongans are Immigrants from Nepal (9.4%, a difference of 0.0%), Immigrants from Bosnia and Herzegovina (9.4%, a difference of 0.27%), Hmong (9.4%, a difference of 0.28%), Osage (9.4%, a difference of 0.28%), and Taiwanese (9.4%, a difference of 0.31%).
| Demographics | Rating | Rank | Unemployment Among Ages 20 to 24 years |
| Immigrants | Sudan | 100.0 /100 | #15 | Exceptional 9.3% |
| Danes | 100.0 /100 | #16 | Exceptional 9.3% |
| Czechs | 100.0 /100 | #17 | Exceptional 9.3% |
| Chinese | 100.0 /100 | #18 | Exceptional 9.4% |
| Hmong | 100.0 /100 | #19 | Exceptional 9.4% |
| Osage | 100.0 /100 | #20 | Exceptional 9.4% |
| Immigrants | Bosnia and Herzegovina | 100.0 /100 | #21 | Exceptional 9.4% |
| Tongans | 100.0 /100 | #22 | Exceptional 9.4% |
| Immigrants | Nepal | 100.0 /100 | #23 | Exceptional 9.4% |
| Taiwanese | 100.0 /100 | #24 | Exceptional 9.4% |
| Immigrants | Eritrea | 100.0 /100 | #25 | Exceptional 9.5% |
| Swedes | 100.0 /100 | #26 | Exceptional 9.5% |
| Immigrants | Zimbabwe | 100.0 /100 | #27 | Exceptional 9.5% |
| Immigrants | Afghanistan | 100.0 /100 | #28 | Exceptional 9.5% |
| Immigrants | North Macedonia | 100.0 /100 | #29 | Exceptional 9.5% |
Demographics Similar to Ethiopians by Unemployment Among Ages 20 to 24 years
In terms of unemployment among ages 20 to 24 years, the demographic groups most similar to Ethiopians are Immigrants from Kenya (9.7%, a difference of 0.070%), Immigrants from Thailand (9.8%, a difference of 0.11%), Creek (9.7%, a difference of 0.21%), Immigrants from Serbia (9.8%, a difference of 0.22%), and Immigrants from Cambodia (9.8%, a difference of 0.26%).
| Demographics | Rating | Rank | Unemployment Among Ages 20 to 24 years |
| Europeans | 99.8 /100 | #44 | Exceptional 9.7% |
| Croatians | 99.8 /100 | #45 | Exceptional 9.7% |
| Immigrants | Nicaragua | 99.8 /100 | #46 | Exceptional 9.7% |
| Immigrants | India | 99.8 /100 | #47 | Exceptional 9.7% |
| Finns | 99.8 /100 | #48 | Exceptional 9.7% |
| Creek | 99.8 /100 | #49 | Exceptional 9.7% |
| Immigrants | Kenya | 99.7 /100 | #50 | Exceptional 9.7% |
| Ethiopians | 99.7 /100 | #51 | Exceptional 9.8% |
| Immigrants | Thailand | 99.7 /100 | #52 | Exceptional 9.8% |
| Immigrants | Serbia | 99.6 /100 | #53 | Exceptional 9.8% |
| Immigrants | Cambodia | 99.6 /100 | #54 | Exceptional 9.8% |
| Carpatho Rusyns | 99.6 /100 | #55 | Exceptional 9.8% |
| Nicaraguans | 99.6 /100 | #56 | Exceptional 9.8% |
| Immigrants | Moldova | 99.5 /100 | #57 | Exceptional 9.8% |
| Pakistanis | 99.5 /100 | #58 | Exceptional 9.8% |