Tongan vs Immigrants from Somalia Unemployment Among Youth under 25 years
COMPARE
Tongan
Immigrants from Somalia
Unemployment Among Youth under 25 years
Unemployment Among Youth under 25 years Comparison
Tongans
Immigrants from Somalia
10.9%
UNEMPLOYMENT AMONG YOUTH UNDER 25 YEARS
99.6/ 100
METRIC RATING
46th/ 347
METRIC RANK
10.5%
UNEMPLOYMENT AMONG YOUTH UNDER 25 YEARS
100.0/ 100
METRIC RATING
10th/ 347
METRIC RANK
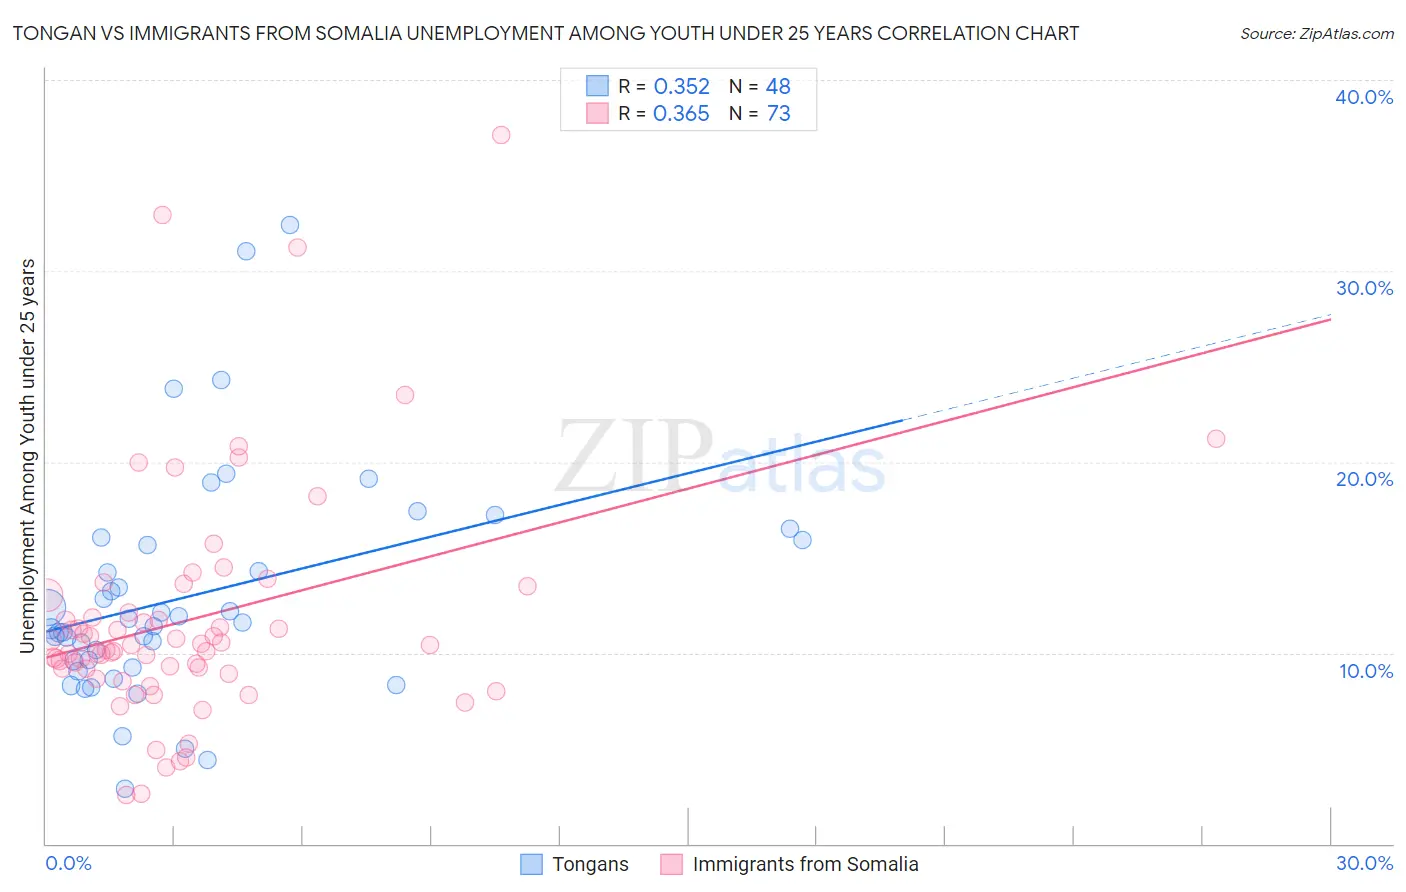
Tongan vs Immigrants from Somalia Unemployment Among Youth under 25 years Correlation Chart
The statistical analysis conducted on geographies consisting of 102,589,279 people shows a mild positive correlation between the proportion of Tongans and unemployment rate among youth under the age of 25 in the United States with a correlation coefficient (R) of 0.352 and weighted average of 10.9%. Similarly, the statistical analysis conducted on geographies consisting of 91,963,358 people shows a mild positive correlation between the proportion of Immigrants from Somalia and unemployment rate among youth under the age of 25 in the United States with a correlation coefficient (R) of 0.365 and weighted average of 10.5%, a difference of 4.0%.
Unemployment Among Youth under 25 years Correlation Summary
| Measurement | Tongan | Immigrants from Somalia |
| Minimum | 2.9% | 2.5% |
| Maximum | 32.4% | 37.1% |
| Range | 29.5% | 34.6% |
| Mean | 12.9% | 11.8% |
| Median | 11.5% | 10.4% |
| Interquartile 25% (IQ1) | 9.4% | 9.0% |
| Interquartile 75% (IQ3) | 15.8% | 12.6% |
| Interquartile Range (IQR) | 6.4% | 3.5% |
| Standard Deviation (Sample) | 6.0% | 6.2% |
| Standard Deviation (Population) | 5.9% | 6.1% |
Similar Demographics by Unemployment Among Youth under 25 years
Demographics Similar to Tongans by Unemployment Among Youth under 25 years
In terms of unemployment among youth under 25 years, the demographic groups most similar to Tongans are Bulgarian (10.9%, a difference of 0.040%), Australian (10.9%, a difference of 0.040%), Welsh (10.9%, a difference of 0.14%), British (10.9%, a difference of 0.17%), and Cambodian (10.9%, a difference of 0.42%).
| Demographics | Rating | Rank | Unemployment Among Youth under 25 years |
| Immigrants | Zaire | 99.8 /100 | #39 | Exceptional 10.9% |
| Scottish | 99.8 /100 | #40 | Exceptional 10.9% |
| Croatians | 99.8 /100 | #41 | Exceptional 10.9% |
| Cambodians | 99.7 /100 | #42 | Exceptional 10.9% |
| British | 99.7 /100 | #43 | Exceptional 10.9% |
| Welsh | 99.7 /100 | #44 | Exceptional 10.9% |
| Bulgarians | 99.6 /100 | #45 | Exceptional 10.9% |
| Tongans | 99.6 /100 | #46 | Exceptional 10.9% |
| Australians | 99.6 /100 | #47 | Exceptional 10.9% |
| Poles | 99.3 /100 | #48 | Exceptional 11.0% |
| Thais | 99.3 /100 | #49 | Exceptional 11.0% |
| Czechoslovakians | 99.2 /100 | #50 | Exceptional 11.0% |
| Serbians | 99.0 /100 | #51 | Exceptional 11.0% |
| Latvians | 99.0 /100 | #52 | Exceptional 11.0% |
| Ottawa | 99.0 /100 | #53 | Exceptional 11.1% |
Demographics Similar to Immigrants from Somalia by Unemployment Among Youth under 25 years
In terms of unemployment among youth under 25 years, the demographic groups most similar to Immigrants from Somalia are German (10.5%, a difference of 0.020%), Scandinavian (10.5%, a difference of 0.13%), Immigrants from Sudan (10.5%, a difference of 0.31%), Immigrants from Venezuela (10.5%, a difference of 0.42%), and Indonesian (10.6%, a difference of 0.43%).
| Demographics | Rating | Rank | Unemployment Among Youth under 25 years |
| Luxembourgers | 100.0 /100 | #3 | Exceptional 10.0% |
| Zimbabweans | 100.0 /100 | #4 | Exceptional 10.2% |
| Czechs | 100.0 /100 | #5 | Exceptional 10.3% |
| Danes | 100.0 /100 | #6 | Exceptional 10.3% |
| Swedes | 100.0 /100 | #7 | Exceptional 10.4% |
| Immigrants | Venezuela | 100.0 /100 | #8 | Exceptional 10.5% |
| Germans | 100.0 /100 | #9 | Exceptional 10.5% |
| Immigrants | Somalia | 100.0 /100 | #10 | Exceptional 10.5% |
| Scandinavians | 100.0 /100 | #11 | Exceptional 10.5% |
| Immigrants | Sudan | 100.0 /100 | #12 | Exceptional 10.5% |
| Indonesians | 100.0 /100 | #13 | Exceptional 10.6% |
| Cubans | 100.0 /100 | #14 | Exceptional 10.6% |
| Sudanese | 100.0 /100 | #15 | Exceptional 10.6% |
| Venezuelans | 100.0 /100 | #16 | Exceptional 10.6% |
| Menominee | 100.0 /100 | #17 | Exceptional 10.6% |