Bahamian vs Blackfeet Unemployment Among Youth under 25 years
COMPARE
Bahamian
Blackfeet
Unemployment Among Youth under 25 years
Unemployment Among Youth under 25 years Comparison
Bahamians
Blackfeet
13.1%
UNEMPLOYMENT AMONG YOUTH UNDER 25 YEARS
0.0/ 100
METRIC RATING
277th/ 347
METRIC RANK
13.3%
UNEMPLOYMENT AMONG YOUTH UNDER 25 YEARS
0.0/ 100
METRIC RATING
286th/ 347
METRIC RANK
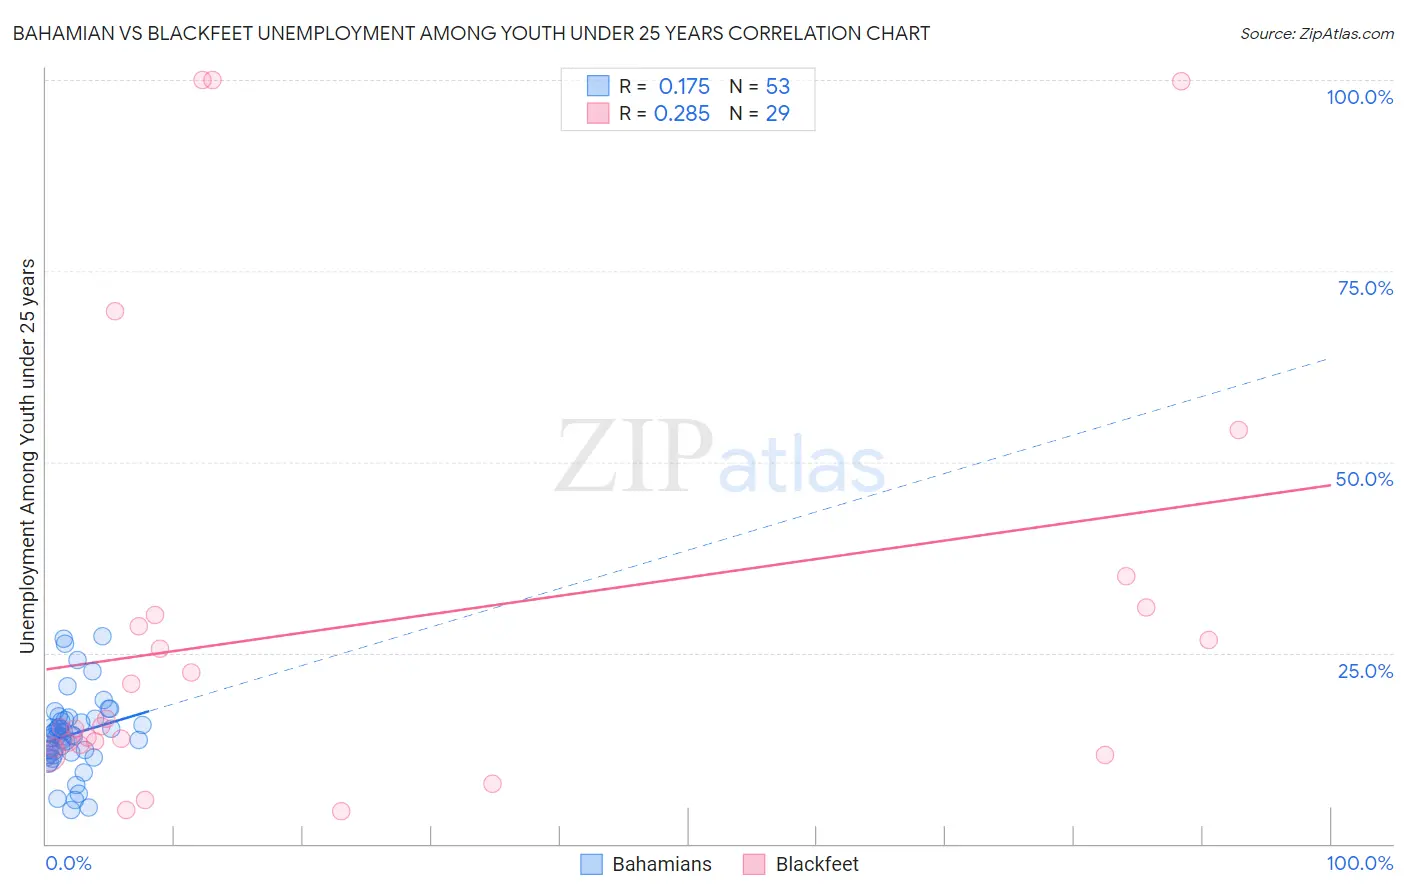
Bahamian vs Blackfeet Unemployment Among Youth under 25 years Correlation Chart
The statistical analysis conducted on geographies consisting of 112,437,072 people shows a poor positive correlation between the proportion of Bahamians and unemployment rate among youth under the age of 25 in the United States with a correlation coefficient (R) of 0.175 and weighted average of 13.1%. Similarly, the statistical analysis conducted on geographies consisting of 306,373,464 people shows a weak positive correlation between the proportion of Blackfeet and unemployment rate among youth under the age of 25 in the United States with a correlation coefficient (R) of 0.285 and weighted average of 13.3%, a difference of 1.4%.
Unemployment Among Youth under 25 years Correlation Summary
| Measurement | Bahamian | Blackfeet |
| Minimum | 4.5% | 4.2% |
| Maximum | 27.2% | 100.0% |
| Range | 22.7% | 95.8% |
| Mean | 14.3% | 28.6% |
| Median | 14.1% | 15.4% |
| Interquartile 25% (IQ1) | 11.6% | 12.8% |
| Interquartile 75% (IQ3) | 16.3% | 30.4% |
| Interquartile Range (IQR) | 4.7% | 17.7% |
| Standard Deviation (Sample) | 5.0% | 28.4% |
| Standard Deviation (Population) | 5.0% | 27.9% |
Demographics Similar to Bahamians and Blackfeet by Unemployment Among Youth under 25 years
In terms of unemployment among youth under 25 years, the demographic groups most similar to Bahamians are Immigrants from Uzbekistan (13.1%, a difference of 0.17%), African (13.2%, a difference of 0.26%), Bermudan (13.0%, a difference of 0.60%), Immigrants from Nigeria (13.0%, a difference of 0.71%), and Cajun (13.2%, a difference of 0.92%). Similarly, the demographic groups most similar to Blackfeet are Ecuadorian (13.3%, a difference of 0.010%), Ghanaian (13.3%, a difference of 0.050%), Lumbee (13.3%, a difference of 0.14%), Immigrants from Cameroon (13.3%, a difference of 0.15%), and Sierra Leonean (13.3%, a difference of 0.17%).
| Demographics | Rating | Rank | Unemployment Among Youth under 25 years |
| Immigrants | Bahamas | 0.0 /100 | #271 | Tragic 12.9% |
| Cape Verdeans | 0.0 /100 | #272 | Tragic 12.9% |
| Nigerians | 0.0 /100 | #273 | Tragic 13.0% |
| Immigrants | Nigeria | 0.0 /100 | #274 | Tragic 13.0% |
| Bermudans | 0.0 /100 | #275 | Tragic 13.0% |
| Immigrants | Uzbekistan | 0.0 /100 | #276 | Tragic 13.1% |
| Bahamians | 0.0 /100 | #277 | Tragic 13.1% |
| Africans | 0.0 /100 | #278 | Tragic 13.2% |
| Cajuns | 0.0 /100 | #279 | Tragic 13.2% |
| Ute | 0.0 /100 | #280 | Tragic 13.3% |
| Armenians | 0.0 /100 | #281 | Tragic 13.3% |
| Sierra Leoneans | 0.0 /100 | #282 | Tragic 13.3% |
| Immigrants | Cameroon | 0.0 /100 | #283 | Tragic 13.3% |
| Lumbee | 0.0 /100 | #284 | Tragic 13.3% |
| Ghanaians | 0.0 /100 | #285 | Tragic 13.3% |
| Blackfeet | 0.0 /100 | #286 | Tragic 13.3% |
| Ecuadorians | 0.0 /100 | #287 | Tragic 13.3% |
| Immigrants | Western Africa | 0.0 /100 | #288 | Tragic 13.4% |
| Immigrants | Ghana | 0.0 /100 | #289 | Tragic 13.4% |
| Immigrants | Ecuador | 0.0 /100 | #290 | Tragic 13.4% |
| Apache | 0.0 /100 | #291 | Tragic 13.5% |