Tohono O'odham vs Immigrants from North Macedonia Unemployment Among Youth under 25 years
COMPARE
Tohono O'odham
Immigrants from North Macedonia
Unemployment Among Youth under 25 years
Unemployment Among Youth under 25 years Comparison
Tohono O'odham
Immigrants from North Macedonia
13.8%
UNEMPLOYMENT AMONG YOUTH UNDER 25 YEARS
0.0/ 100
METRIC RATING
299th/ 347
METRIC RANK
10.7%
UNEMPLOYMENT AMONG YOUTH UNDER 25 YEARS
100.0/ 100
METRIC RATING
25th/ 347
METRIC RANK
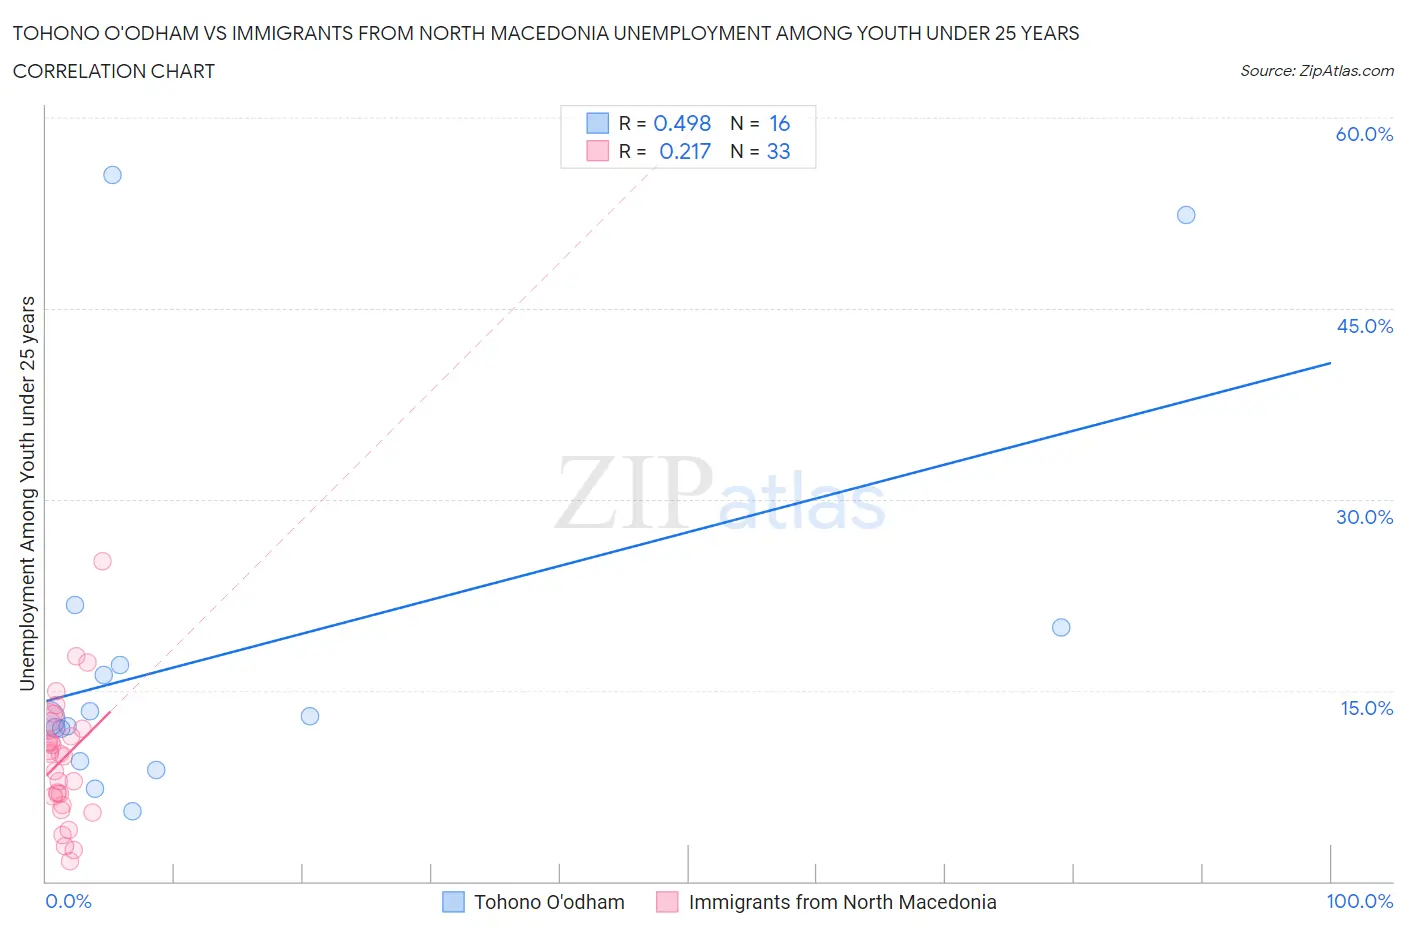
Tohono O'odham vs Immigrants from North Macedonia Unemployment Among Youth under 25 years Correlation Chart
The statistical analysis conducted on geographies consisting of 58,638,484 people shows a moderate positive correlation between the proportion of Tohono O'odham and unemployment rate among youth under the age of 25 in the United States with a correlation coefficient (R) of 0.498 and weighted average of 13.8%. Similarly, the statistical analysis conducted on geographies consisting of 74,088,499 people shows a weak positive correlation between the proportion of Immigrants from North Macedonia and unemployment rate among youth under the age of 25 in the United States with a correlation coefficient (R) of 0.217 and weighted average of 10.7%, a difference of 29.2%.
Unemployment Among Youth under 25 years Correlation Summary
| Measurement | Tohono O'odham | Immigrants from North Macedonia |
| Minimum | 5.5% | 1.6% |
| Maximum | 55.5% | 25.1% |
| Range | 50.0% | 23.5% |
| Mean | 18.1% | 9.6% |
| Median | 12.9% | 10.0% |
| Interquartile 25% (IQ1) | 10.7% | 6.4% |
| Interquartile 75% (IQ3) | 18.5% | 12.3% |
| Interquartile Range (IQR) | 7.7% | 5.9% |
| Standard Deviation (Sample) | 14.6% | 4.9% |
| Standard Deviation (Population) | 14.2% | 4.8% |
Similar Demographics by Unemployment Among Youth under 25 years
Demographics Similar to Tohono O'odham by Unemployment Among Youth under 25 years
In terms of unemployment among youth under 25 years, the demographic groups most similar to Tohono O'odham are Immigrants from Cabo Verde (13.8%, a difference of 0.21%), Shoshone (13.7%, a difference of 0.22%), Immigrants from Senegal (13.8%, a difference of 0.38%), Immigrants from Sierra Leone (13.8%, a difference of 0.43%), and Belizean (13.8%, a difference of 0.46%).
| Demographics | Rating | Rank | Unemployment Among Youth under 25 years |
| Central American Indians | 0.0 /100 | #292 | Tragic 13.5% |
| Spanish American Indians | 0.0 /100 | #293 | Tragic 13.5% |
| Immigrants | Caribbean | 0.0 /100 | #294 | Tragic 13.5% |
| Chippewa | 0.0 /100 | #295 | Tragic 13.5% |
| Senegalese | 0.0 /100 | #296 | Tragic 13.5% |
| U.S. Virgin Islanders | 0.0 /100 | #297 | Tragic 13.6% |
| Shoshone | 0.0 /100 | #298 | Tragic 13.7% |
| Tohono O'odham | 0.0 /100 | #299 | Tragic 13.8% |
| Immigrants | Cabo Verde | 0.0 /100 | #300 | Tragic 13.8% |
| Immigrants | Senegal | 0.0 /100 | #301 | Tragic 13.8% |
| Immigrants | Sierra Leone | 0.0 /100 | #302 | Tragic 13.8% |
| Belizeans | 0.0 /100 | #303 | Tragic 13.8% |
| Houma | 0.0 /100 | #304 | Tragic 13.8% |
| Haitians | 0.0 /100 | #305 | Tragic 13.9% |
| Pueblo | 0.0 /100 | #306 | Tragic 13.9% |
Demographics Similar to Immigrants from North Macedonia by Unemployment Among Youth under 25 years
In terms of unemployment among youth under 25 years, the demographic groups most similar to Immigrants from North Macedonia are Finnish (10.7%, a difference of 0.0%), Immigrants from India (10.7%, a difference of 0.10%), Yugoslavian (10.7%, a difference of 0.11%), Somali (10.7%, a difference of 0.15%), and Immigrants from Bosnia and Herzegovina (10.6%, a difference of 0.24%).
| Demographics | Rating | Rank | Unemployment Among Youth under 25 years |
| Swiss | 100.0 /100 | #18 | Exceptional 10.6% |
| Immigrants | Burma/Myanmar | 100.0 /100 | #19 | Exceptional 10.6% |
| Dutch | 100.0 /100 | #20 | Exceptional 10.6% |
| Pennsylvania Germans | 100.0 /100 | #21 | Exceptional 10.6% |
| Belgians | 100.0 /100 | #22 | Exceptional 10.6% |
| Immigrants | Bosnia and Herzegovina | 100.0 /100 | #23 | Exceptional 10.6% |
| Finns | 100.0 /100 | #24 | Exceptional 10.7% |
| Immigrants | North Macedonia | 100.0 /100 | #25 | Exceptional 10.7% |
| Immigrants | India | 100.0 /100 | #26 | Exceptional 10.7% |
| Yugoslavians | 100.0 /100 | #27 | Exceptional 10.7% |
| Somalis | 100.0 /100 | #28 | Exceptional 10.7% |
| Chinese | 99.9 /100 | #29 | Exceptional 10.7% |
| Osage | 99.9 /100 | #30 | Exceptional 10.7% |
| Slovenes | 99.9 /100 | #31 | Exceptional 10.7% |
| Taiwanese | 99.9 /100 | #32 | Exceptional 10.8% |