Tlingit-Haida vs Immigrants Unemployment Among Seniors over 75 years
COMPARE
Tlingit-Haida
Immigrants
Unemployment Among Seniors over 75 years
Unemployment Among Seniors over 75 years Comparison
Tlingit-Haida
Immigrants
20.7%
UNEMPLOYMENT AMONG SENIORS OVER 75 YEARS
0.0/ 100
METRIC RATING
346th/ 347
METRIC RANK
8.7%
UNEMPLOYMENT AMONG SENIORS OVER 75 YEARS
51.8/ 100
METRIC RATING
172nd/ 347
METRIC RANK
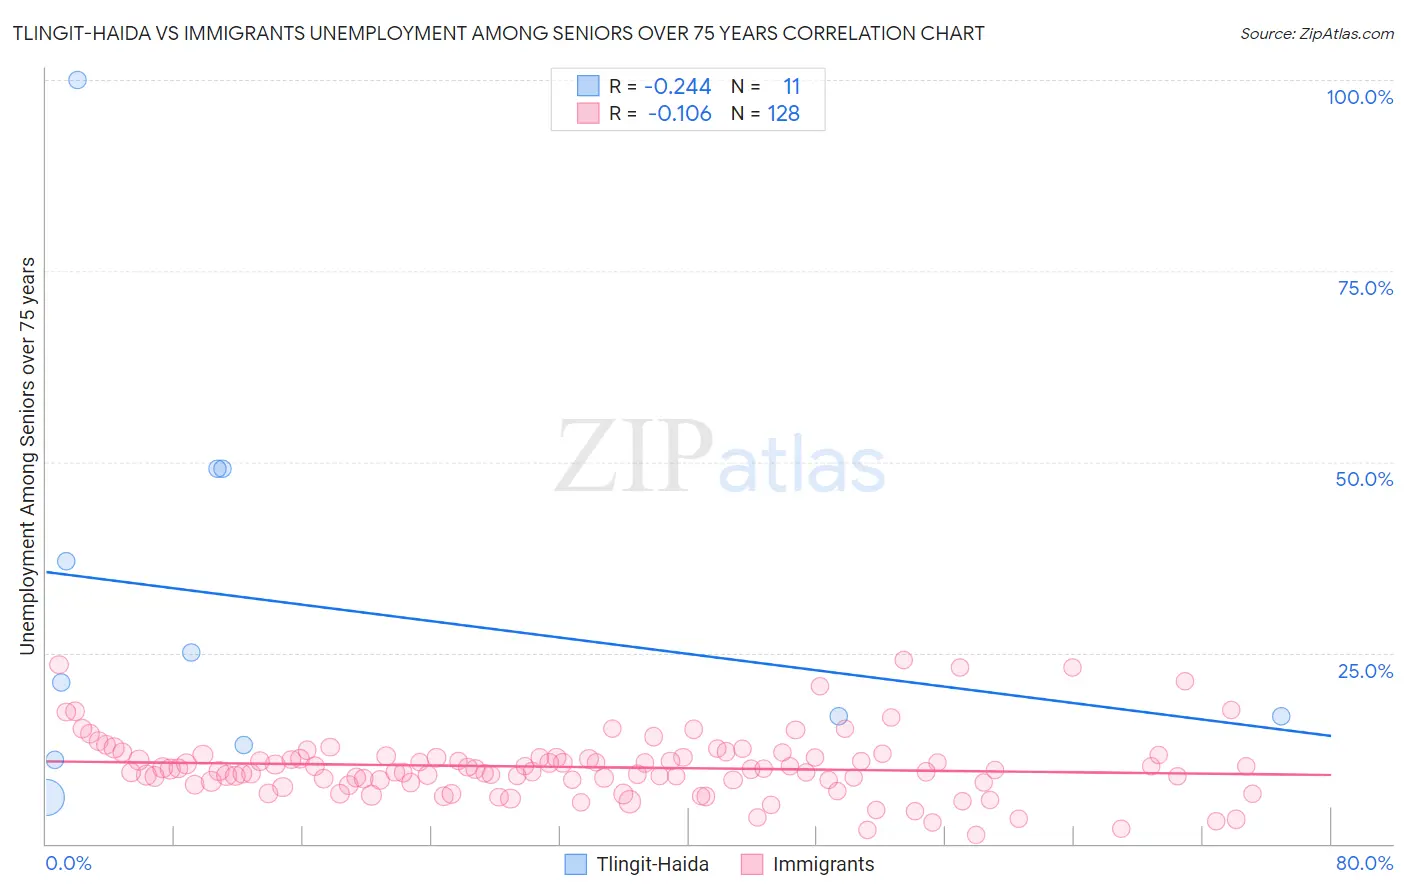
Tlingit-Haida vs Immigrants Unemployment Among Seniors over 75 years Correlation Chart
The statistical analysis conducted on geographies consisting of 44,675,055 people shows a weak negative correlation between the proportion of Tlingit-Haida and unemployment rate among seniors over the age of 75 in the United States with a correlation coefficient (R) of -0.244 and weighted average of 20.7%. Similarly, the statistical analysis conducted on geographies consisting of 234,787,116 people shows a poor negative correlation between the proportion of Immigrants and unemployment rate among seniors over the age of 75 in the United States with a correlation coefficient (R) of -0.106 and weighted average of 8.7%, a difference of 137.3%.
Unemployment Among Seniors over 75 years Correlation Summary
| Measurement | Tlingit-Haida | Immigrants |
| Minimum | 6.1% | 1.1% |
| Maximum | 100.0% | 24.1% |
| Range | 93.9% | 23.0% |
| Mean | 31.3% | 10.0% |
| Median | 21.1% | 9.7% |
| Interquartile 25% (IQ1) | 13.0% | 8.1% |
| Interquartile 75% (IQ3) | 49.1% | 11.3% |
| Interquartile Range (IQR) | 36.1% | 3.2% |
| Standard Deviation (Sample) | 27.1% | 4.2% |
| Standard Deviation (Population) | 25.8% | 4.2% |
Similar Demographics by Unemployment Among Seniors over 75 years
Demographics Similar to Tlingit-Haida by Unemployment Among Seniors over 75 years
In terms of unemployment among seniors over 75 years, the demographic groups most similar to Tlingit-Haida are Yakama (18.4%, a difference of 12.6%), Immigrants from Yemen (16.5%, a difference of 25.8%), Alaska Native (14.7%, a difference of 41.4%), Hmong (13.7%, a difference of 51.0%), and Lumbee (13.5%, a difference of 54.1%).
| Demographics | Rating | Rank | Unemployment Among Seniors over 75 years |
| Alaskan Athabascans | 0.0 /100 | #333 | Tragic 11.0% |
| Assyrians/Chaldeans/Syriacs | 0.0 /100 | #334 | Tragic 11.1% |
| French Canadians | 0.0 /100 | #335 | Tragic 11.2% |
| Immigrants | North Macedonia | 0.0 /100 | #336 | Tragic 11.3% |
| Cape Verdeans | 0.0 /100 | #337 | Tragic 11.4% |
| Immigrants | Cabo Verde | 0.0 /100 | #338 | Tragic 12.3% |
| Cajuns | 0.0 /100 | #339 | Tragic 12.5% |
| Yup'ik | 0.0 /100 | #340 | Tragic 12.8% |
| Lumbee | 0.0 /100 | #341 | Tragic 13.5% |
| Hmong | 0.0 /100 | #342 | Tragic 13.7% |
| Alaska Natives | 0.0 /100 | #343 | Tragic 14.7% |
| Immigrants | Yemen | 0.0 /100 | #344 | Tragic 16.5% |
| Yakama | 0.0 /100 | #345 | Tragic 18.4% |
| Tlingit-Haida | 0.0 /100 | #346 | Tragic 20.7% |
Demographics Similar to Immigrants by Unemployment Among Seniors over 75 years
In terms of unemployment among seniors over 75 years, the demographic groups most similar to Immigrants are Dominican (8.7%, a difference of 0.0%), Australian (8.7%, a difference of 0.080%), Immigrants from El Salvador (8.7%, a difference of 0.11%), Zimbabwean (8.7%, a difference of 0.12%), and Syrian (8.7%, a difference of 0.12%).
| Demographics | Rating | Rank | Unemployment Among Seniors over 75 years |
| Immigrants | Dominican Republic | 61.4 /100 | #165 | Good 8.7% |
| Immigrants | Belize | 57.6 /100 | #166 | Average 8.7% |
| Immigrants | Eastern Africa | 57.6 /100 | #167 | Average 8.7% |
| Immigrants | Lithuania | 57.2 /100 | #168 | Average 8.7% |
| Fijians | 56.4 /100 | #169 | Average 8.7% |
| Zimbabweans | 54.1 /100 | #170 | Average 8.7% |
| Dominicans | 51.9 /100 | #171 | Average 8.7% |
| Immigrants | Immigrants | 51.8 /100 | #172 | Average 8.7% |
| Australians | 50.3 /100 | #173 | Average 8.7% |
| Immigrants | El Salvador | 49.7 /100 | #174 | Average 8.7% |
| Syrians | 49.6 /100 | #175 | Average 8.7% |
| Somalis | 45.3 /100 | #176 | Average 8.8% |
| Central Americans | 43.3 /100 | #177 | Average 8.8% |
| West Indians | 41.9 /100 | #178 | Average 8.8% |
| Immigrants | Italy | 41.7 /100 | #179 | Average 8.8% |