Tlingit-Haida vs Immigrants from South America Unemployment Among Seniors over 75 years

COMPARE

Tlingit-Haida
Race
Ancestry
AfghanAfricanAlaska NativeAlaskan AthabascanAlbanianAleutAlsatianAmericanApacheArabArapahoArgentineanArmenianAssyrian/Chaldean/SyriacAustralianAustrianBahamianBangladeshiBarbadianBasqueBelgianBelizeanBermudanBhutaneseBlackfeetBolivianBrazilianBritishBritish West IndianBulgarianBurmeseCajunCambodianCanadianCape VerdeanCarpatho RusynCelticCentral AmericanCentral American IndianCherokeeCheyenneChickasawChileanChineseChippewaChoctawColombianColvilleComancheCosta RicanCreeCreekCroatianCrowCubanCypriotCzechCzechoslovakianDanishDelawareDominicanDutchDutch West IndianEastern EuropeanEcuadorianEgyptianEnglishEstonianEthiopianEuropeanFijianFilipinoFinnishFrenchFrench American IndianFrench CanadianGermanGerman RussianGhanaianGreekGuamanian/ChamorroGuatemalanGuyaneseHaitianHmongHonduranHopiHoumaHungarianIcelanderIndian (Asian)IndonesianInupiatIranianIraqiIrishIroquoisIsraeliItalianJamaicanJapaneseJordanianKenyanKiowaKoreanLaotianLatvianLebaneseLiberianLithuanianLumbeeLuxembourgerMacedonianMalaysianMalteseMarshalleseMexicanMexican American IndianMongolianMoroccanNative HawaiianNavajoNepaleseNew ZealanderNicaraguanNigerianNorthern EuropeanNorwegianOkinawanOsageOttawaPaiutePakistaniPalestinianPanamanianParaguayanPennsylvania GermanPeruvianPimaPolishPortuguesePotawatomiPuebloPuerto RicanPuget Sound SalishRomanianRussianSalvadoranSamoanScandinavianScotch-IrishScottishSeminoleSenegaleseSerbianShoshoneSierra LeoneanSiouxSlavicSlovakSloveneSomaliSouth AfricanSouth AmericanSouth American IndianSoviet UnionSpaniardSpanishSpanish AmericanSpanish American IndianSri LankanSubsaharan AfricanSudaneseSwedishSwissSyrianTaiwaneseThaiTlingit-HaidaTohono O'OdhamTonganTrinidadian and TobagonianTsimshianTurkishU.S. Virgin IslanderUgandanUkrainianUruguayanUteVenezuelanVietnameseWelshWest IndianYakamaYaquiYugoslavianYumanYup'ikZimbabwean
Immigration
NonimmigrantsImmigrantsAfghanistanAfricaAlbaniaArgentinaArmeniaAsiaAustraliaAustriaBahamasBangladeshBarbadosBelarusBelgiumBelizeBoliviaBosnia and HerzegovinaBrazilBulgariaBurma/MyanmarCabo VerdeCambodiaCameroonCanadaCaribbeanCentral AmericaChileChinaColombiaCongoCosta RicaCroatiaCubaCzechoslovakiaDenmarkDominicaDominican RepublicEastern AfricaEastern AsiaEastern EuropeEcuadorEgyptEl SalvadorEnglandEritreaEthiopiaEuropeFijiFranceGermanyGhanaGreeceGrenadaGuatemalaGuyanaHaitiHondurasHong KongHungaryIndiaIndonesiaIranIraqIrelandIsraelItalyJamaicaJapanJordanKazakhstanKenyaKoreaKuwaitLaosLatin AmericaLatviaLebanonLiberiaLithuaniaMalaysiaMexicoMicronesiaMiddle AfricaMoldovaMoroccoNepalNetherlandsNicaraguaNigeriaNorth AmericaNorth MacedoniaNorthern AfricaNorthern EuropeNorwayOceaniaPakistanPanamaPeruPhilippinesPolandPortugalRomaniaRussiaSaudi ArabiaScotlandSenegalSerbiaSierra LeoneSingaporeSomaliaSouth AfricaSouth Central AsiaSouth Eastern AsiaSouthern EuropeSpainSri LankaSt. Vincent and the GrenadinesSudanSwedenSwitzerlandSyriaTaiwanThailandTrinidad and TobagoTurkeyUgandaUkraineUruguayUzbekistanVenezuelaVietnamWest IndiesWestern AfricaWestern AsiaWestern EuropeYemenZaireZimbabweAzores
Immigrants from South America
Race
Ancestry
AfghanAfricanAlaska NativeAlaskan AthabascanAlbanianAleutAlsatianAmericanApacheArabArapahoArgentineanArmenianAssyrian/Chaldean/SyriacAustralianAustrianBahamianBangladeshiBarbadianBasqueBelgianBelizeanBermudanBhutaneseBlackfeetBolivianBrazilianBritishBritish West IndianBulgarianBurmeseCajunCambodianCanadianCape VerdeanCarpatho RusynCelticCentral AmericanCentral American IndianCherokeeCheyenneChickasawChileanChineseChippewaChoctawColombianColvilleComancheCosta RicanCreeCreekCroatianCrowCubanCypriotCzechCzechoslovakianDanishDelawareDominicanDutchDutch West IndianEastern EuropeanEcuadorianEgyptianEnglishEstonianEthiopianEuropeanFijianFilipinoFinnishFrenchFrench American IndianFrench CanadianGermanGerman RussianGhanaianGreekGuamanian/ChamorroGuatemalanGuyaneseHaitianHmongHonduranHopiHoumaHungarianIcelanderIndian (Asian)IndonesianInupiatIranianIraqiIrishIroquoisIsraeliItalianJamaicanJapaneseJordanianKenyanKiowaKoreanLaotianLatvianLebaneseLiberianLithuanianLumbeeLuxembourgerMacedonianMalaysianMalteseMarshalleseMexicanMexican American IndianMongolianMoroccanNative HawaiianNavajoNepaleseNew ZealanderNicaraguanNigerianNorthern EuropeanNorwegianOkinawanOsageOttawaPaiutePakistaniPalestinianPanamanianParaguayanPennsylvania GermanPeruvianPimaPolishPortuguesePotawatomiPuebloPuerto RicanPuget Sound SalishRomanianRussianSalvadoranSamoanScandinavianScotch-IrishScottishSeminoleSenegaleseSerbianShoshoneSierra LeoneanSiouxSlavicSlovakSloveneSomaliSouth AfricanSouth AmericanSouth American IndianSoviet UnionSpaniardSpanishSpanish AmericanSpanish American IndianSri LankanSubsaharan AfricanSudaneseSwedishSwissSyrianTaiwaneseThaiTohono O'OdhamTonganTrinidadian and TobagonianTsimshianTurkishU.S. Virgin IslanderUgandanUkrainianUruguayanUteVenezuelanVietnameseWelshWest IndianYakamaYaquiYugoslavianYumanYup'ikZimbabwean
Immigration
NonimmigrantsImmigrantsAfghanistanAfricaAlbaniaArgentinaArmeniaAsiaAustraliaAustriaBahamasBangladeshBarbadosBelarusBelgiumBelizeBoliviaBosnia and HerzegovinaBrazilBulgariaBurma/MyanmarCabo VerdeCambodiaCameroonCanadaCaribbeanCentral AmericaChileChinaColombiaCongoCosta RicaCroatiaCubaCzechoslovakiaDenmarkDominicaDominican RepublicEastern AfricaEastern AsiaEastern EuropeEcuadorEgyptEl SalvadorEnglandEritreaEthiopiaEuropeFijiFranceGermanyGhanaGreeceGrenadaGuatemalaGuyanaHaitiHondurasHong KongHungaryIndiaIndonesiaIranIraqIrelandIsraelItalyJamaicaJapanJordanKazakhstanKenyaKoreaKuwaitLaosLatin AmericaLatviaLebanonLiberiaLithuaniaMalaysiaMexicoMicronesiaMiddle AfricaMoldovaMoroccoNepalNetherlandsNicaraguaNigeriaNorth AmericaNorth MacedoniaNorthern AfricaNorthern EuropeNorwayOceaniaPakistanPanamaPeruPhilippinesPolandPortugalRomaniaRussiaSaudi ArabiaScotlandSenegalSerbiaSierra LeoneSingaporeSomaliaSouth AfricaSouth AmericaSouth Central AsiaSouth Eastern AsiaSouthern EuropeSpainSri LankaSt. Vincent and the GrenadinesSudanSwedenSwitzerlandSyriaTaiwanThailandTrinidad and TobagoTurkeyUgandaUkraineUruguayUzbekistanVenezuelaVietnamWest IndiesWestern AfricaWestern AsiaWestern EuropeYemenZaireZimbabweAzores
Unemployment Among Seniors over 75 years
Income
Poverty
Unemployment
Labor Participation
Family Structure
Vehicle Availability
Education Level
Disability

Unemployment Among Seniors over 75 years Comparison

Tlingit-Haida

Immigrants from South America

Tragic
Good
20.7%
UNEMPLOYMENT AMONG SENIORS OVER 75 YEARS
0.0/ 100
METRIC RATING
346th/ 347
METRIC RANK
8.6%
UNEMPLOYMENT AMONG SENIORS OVER 75 YEARS
71.3/ 100
METRIC RATING
162nd/ 347
METRIC RANK

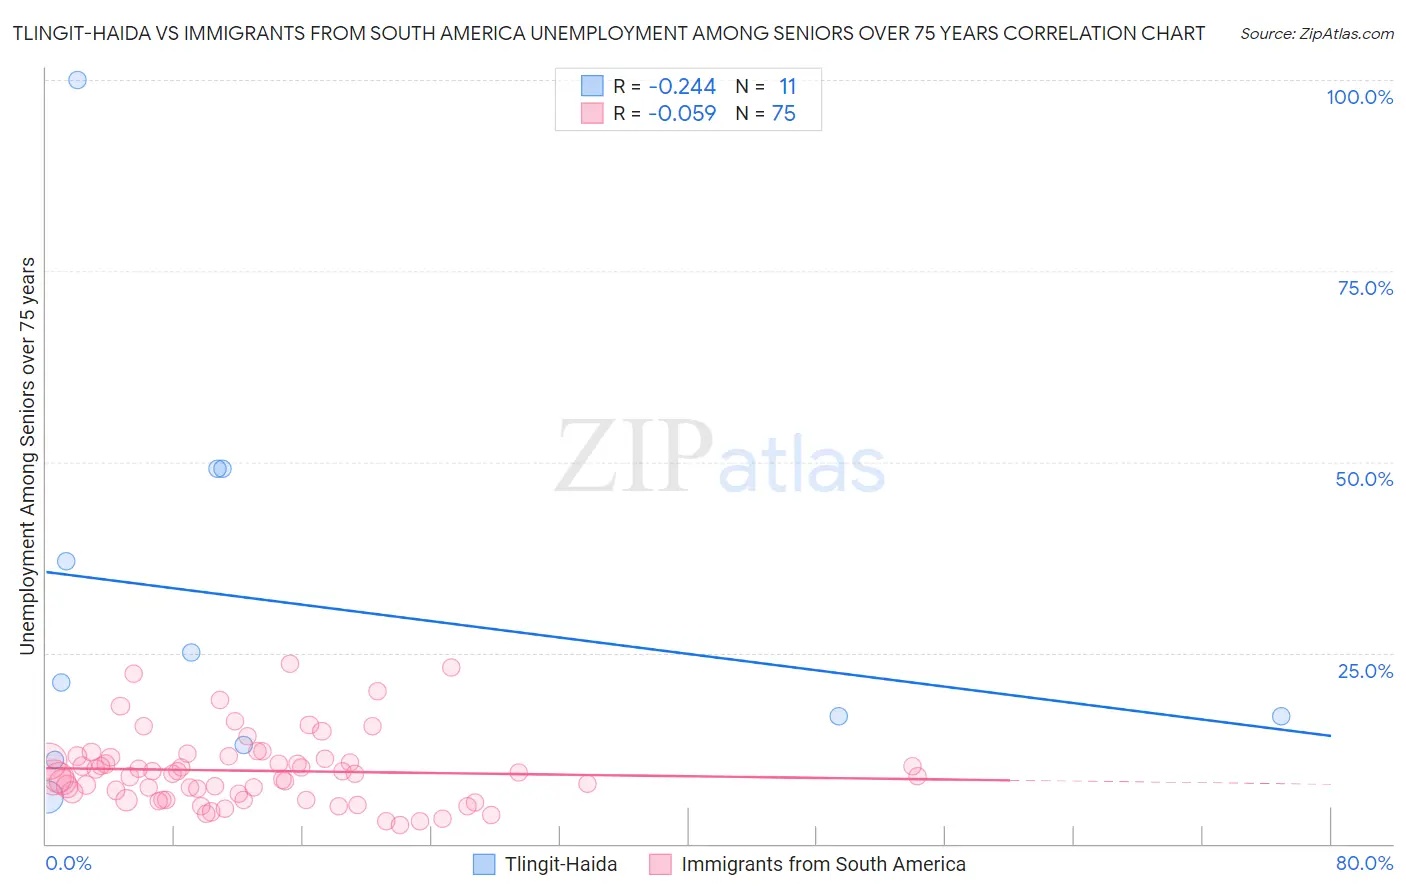
Tlingit-Haida vs Immigrants from South America Unemployment Among Seniors over 75 years Correlation Chart

The statistical analysis conducted on geographies consisting of 44,675,055 people shows a weak negative correlation between the proportion of Tlingit-Haida and unemployment rate among seniors over the age of 75 in the United States with a correlation coefficient (R) of -0.244 and weighted average of 20.7%. Similarly, the statistical analysis conducted on geographies consisting of 224,227,019 people shows a slight negative correlation between the proportion of Immigrants from South America and unemployment rate among seniors over the age of 75 in the United States with a correlation coefficient (R) of -0.059 and weighted average of 8.6%, a difference of 140.0%.
Tlingit-Haida vs Immigrants from South America Unemployment Among Seniors over 75 years

Unemployment Among Seniors over 75 years Correlation Summary

MeasurementTlingit-HaidaImmigrants from South America
Minimum6.1%2.4%
Maximum100.0%23.6%
Range93.9%21.2%
Mean31.3%9.6%
Median21.1%9.2%
Interquartile 25% (IQ1)13.0%5.8%
Interquartile 75% (IQ3)49.1%11.3%
Interquartile Range (IQR)36.1%5.5%
Standard Deviation (Sample)27.1%4.7%
Standard Deviation (Population)25.8%4.6%

Similar Demographics by Unemployment Among Seniors over 75 years

Demographics Similar to Tlingit-Haida by Unemployment Among Seniors over 75 years

In terms of unemployment among seniors over 75 years, the demographic groups most similar to Tlingit-Haida are Yakama (18.4%, a difference of 12.6%), Immigrants from Yemen (16.5%, a difference of 25.8%), Alaska Native (14.7%, a difference of 41.4%), Hmong (13.7%, a difference of 51.0%), and Lumbee (13.5%, a difference of 54.1%).
DemographicsRating | RankUnemployment Among Seniors over 75 years
Alaskan Athabascans
0.0
/100
|
#333
Tragic
11.0%
Assyrians/Chaldeans/Syriacs
0.0
/100
|
#334
Tragic
11.1%
French Canadians
0.0
/100
|
#335
Tragic
11.2%
Immigrants | North Macedonia
0.0
/100
|
#336
Tragic
11.3%
Cape Verdeans
0.0
/100
|
#337
Tragic
11.4%
Immigrants | Cabo Verde
0.0
/100
|
#338
Tragic
12.3%
Cajuns
0.0
/100
|
#339
Tragic
12.5%
Yup'ik
0.0
/100
|
#340
Tragic
12.8%
Lumbee
0.0
/100
|
#341
Tragic
13.5%
Hmong
0.0
/100
|
#342
Tragic
13.7%
Alaska Natives
0.0
/100
|
#343
Tragic
14.7%
Immigrants | Yemen
0.0
/100
|
#344
Tragic
16.5%
Yakama
0.0
/100
|
#345
Tragic
18.4%
Tlingit-Haida
0.0
/100
|
#346
Tragic
20.7%

Demographics Similar to Immigrants from South America by Unemployment Among Seniors over 75 years

In terms of unemployment among seniors over 75 years, the demographic groups most similar to Immigrants from South America are Cree (8.6%, a difference of 0.10%), Albanian (8.6%, a difference of 0.10%), Immigrants from Guatemala (8.7%, a difference of 0.19%), Shoshone (8.6%, a difference of 0.23%), and Ethiopian (8.6%, a difference of 0.28%).
DemographicsRating | RankUnemployment Among Seniors over 75 years
Ecuadorians
78.5
/100
|
#155
Good
8.6%
Immigrants | Bahamas
76.5
/100
|
#156
Good
8.6%
Turks
76.4
/100
|
#157
Good
8.6%
Ethiopians
75.3
/100
|
#158
Good
8.6%
Shoshone
74.6
/100
|
#159
Good
8.6%
Cree
72.8
/100
|
#160
Good
8.6%
Albanians
72.8
/100
|
#161
Good
8.6%
Immigrants | South America
71.3
/100
|
#162
Good
8.6%
Immigrants | Guatemala
68.4
/100
|
#163
Good
8.7%
Paraguayans
62.2
/100
|
#164
Good
8.7%
Immigrants | Dominican Republic
61.4
/100
|
#165
Good
8.7%
Immigrants | Belize
57.6
/100
|
#166
Average
8.7%
Immigrants | Eastern Africa
57.6
/100
|
#167
Average
8.7%
Immigrants | Lithuania
57.2
/100
|
#168
Average
8.7%
Fijians
56.4
/100
|
#169
Average
8.7%