Blackfeet vs Immigrants from Micronesia Unemployment Among Ages 30 to 34 years
COMPARE
Blackfeet
Immigrants from Micronesia
Unemployment Among Ages 30 to 34 years
Unemployment Among Ages 30 to 34 years Comparison
Blackfeet
Immigrants from Micronesia
6.3%
UNEMPLOYMENT AMONG AGES 30 TO 34 YEARS
0.0/ 100
METRIC RATING
272nd/ 347
METRIC RANK
6.0%
UNEMPLOYMENT AMONG AGES 30 TO 34 YEARS
0.3/ 100
METRIC RATING
244th/ 347
METRIC RANK
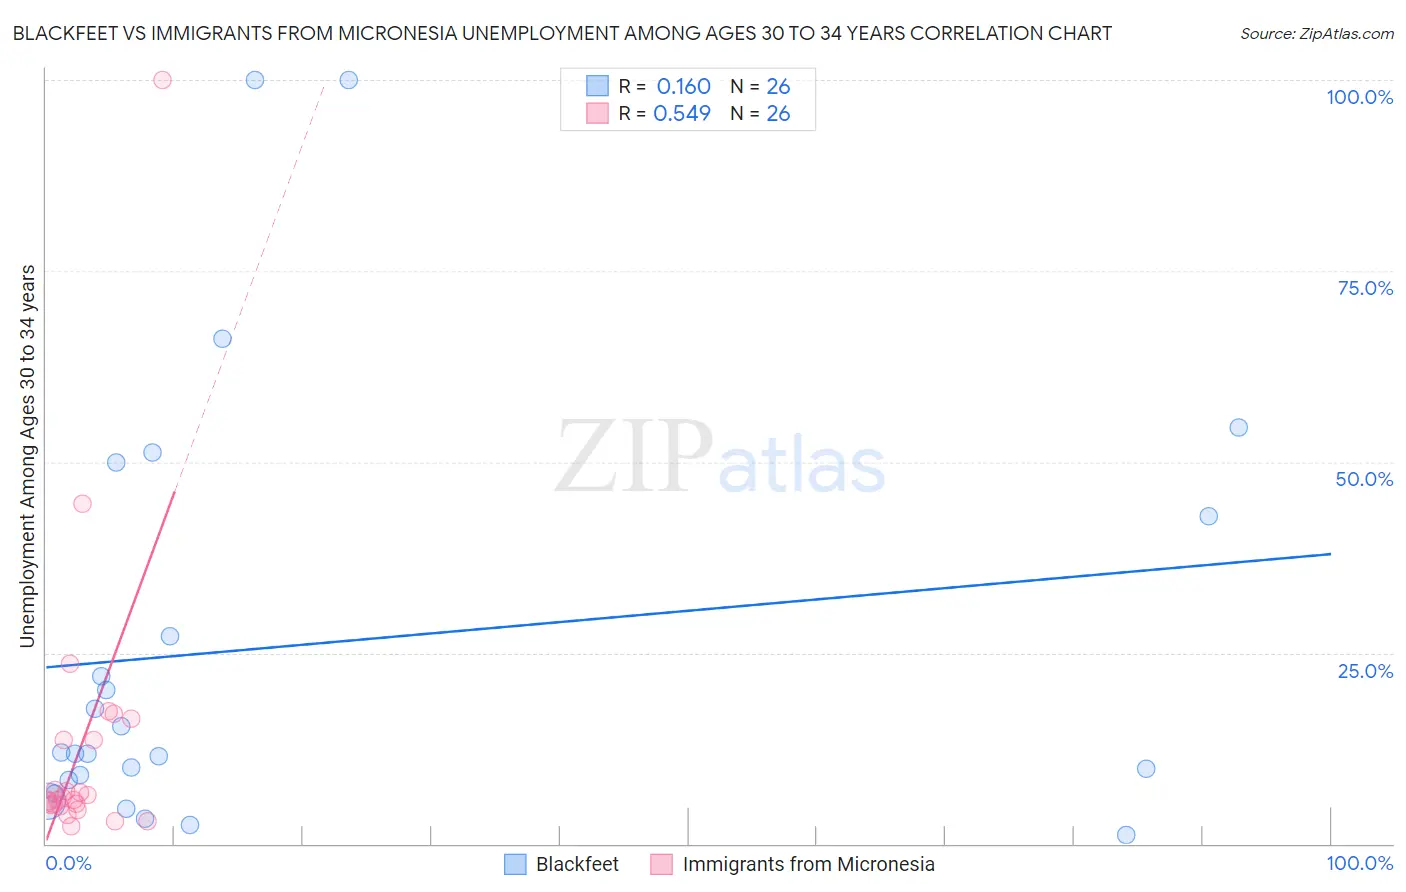
Blackfeet vs Immigrants from Micronesia Unemployment Among Ages 30 to 34 years Correlation Chart
The statistical analysis conducted on geographies consisting of 294,748,447 people shows a poor positive correlation between the proportion of Blackfeet and unemployment rate among population between the ages 30 and 34 in the United States with a correlation coefficient (R) of 0.160 and weighted average of 6.3%. Similarly, the statistical analysis conducted on geographies consisting of 60,757,387 people shows a substantial positive correlation between the proportion of Immigrants from Micronesia and unemployment rate among population between the ages 30 and 34 in the United States with a correlation coefficient (R) of 0.549 and weighted average of 6.0%, a difference of 4.6%.
Unemployment Among Ages 30 to 34 years Correlation Summary
| Measurement | Blackfeet | Immigrants from Micronesia |
| Minimum | 1.2% | 2.3% |
| Maximum | 100.0% | 100.0% |
| Range | 98.8% | 97.7% |
| Mean | 25.9% | 13.0% |
| Median | 11.9% | 5.9% |
| Interquartile 25% (IQ1) | 8.4% | 5.1% |
| Interquartile 75% (IQ3) | 42.9% | 13.6% |
| Interquartile Range (IQR) | 34.5% | 8.5% |
| Standard Deviation (Sample) | 28.3% | 19.9% |
| Standard Deviation (Population) | 27.7% | 19.5% |
Similar Demographics by Unemployment Among Ages 30 to 34 years
Demographics Similar to Blackfeet by Unemployment Among Ages 30 to 34 years
In terms of unemployment among ages 30 to 34 years, the demographic groups most similar to Blackfeet are Ottawa (6.3%, a difference of 0.010%), U.S. Virgin Islander (6.3%, a difference of 0.020%), Comanche (6.3%, a difference of 0.11%), Ecuadorian (6.3%, a difference of 0.13%), and Pennsylvania German (6.3%, a difference of 0.18%).
| Demographics | Rating | Rank | Unemployment Among Ages 30 to 34 years |
| Americans | 0.0 /100 | #265 | Tragic 6.2% |
| Seminole | 0.0 /100 | #266 | Tragic 6.2% |
| Immigrants | Mexico | 0.0 /100 | #267 | Tragic 6.2% |
| Immigrants | Haiti | 0.0 /100 | #268 | Tragic 6.2% |
| French American Indians | 0.0 /100 | #269 | Tragic 6.3% |
| Immigrants | Senegal | 0.0 /100 | #270 | Tragic 6.3% |
| Comanche | 0.0 /100 | #271 | Tragic 6.3% |
| Blackfeet | 0.0 /100 | #272 | Tragic 6.3% |
| Ottawa | 0.0 /100 | #273 | Tragic 6.3% |
| U.S. Virgin Islanders | 0.0 /100 | #274 | Tragic 6.3% |
| Ecuadorians | 0.0 /100 | #275 | Tragic 6.3% |
| Pennsylvania Germans | 0.0 /100 | #276 | Tragic 6.3% |
| Immigrants | Ecuador | 0.0 /100 | #277 | Tragic 6.3% |
| Osage | 0.0 /100 | #278 | Tragic 6.3% |
| Cree | 0.0 /100 | #279 | Tragic 6.4% |
Demographics Similar to Immigrants from Micronesia by Unemployment Among Ages 30 to 34 years
In terms of unemployment among ages 30 to 34 years, the demographic groups most similar to Immigrants from Micronesia are Subsaharan African (6.0%, a difference of 0.020%), Immigrants from Liberia (6.0%, a difference of 0.15%), Ghanaian (6.0%, a difference of 0.20%), Guatemalan (6.0%, a difference of 0.21%), and Nigerian (6.0%, a difference of 0.27%).
| Demographics | Rating | Rank | Unemployment Among Ages 30 to 34 years |
| Central Americans | 0.6 /100 | #237 | Tragic 5.9% |
| Mexican American Indians | 0.6 /100 | #238 | Tragic 5.9% |
| Immigrants | Nigeria | 0.6 /100 | #239 | Tragic 6.0% |
| Salvadorans | 0.5 /100 | #240 | Tragic 6.0% |
| Immigrants | El Salvador | 0.5 /100 | #241 | Tragic 6.0% |
| Guatemalans | 0.4 /100 | #242 | Tragic 6.0% |
| Immigrants | Liberia | 0.4 /100 | #243 | Tragic 6.0% |
| Immigrants | Micronesia | 0.3 /100 | #244 | Tragic 6.0% |
| Sub-Saharan Africans | 0.3 /100 | #245 | Tragic 6.0% |
| Ghanaians | 0.3 /100 | #246 | Tragic 6.0% |
| Nigerians | 0.3 /100 | #247 | Tragic 6.0% |
| Immigrants | Guatemala | 0.3 /100 | #248 | Tragic 6.0% |
| Hondurans | 0.3 /100 | #249 | Tragic 6.0% |
| Immigrants | Honduras | 0.3 /100 | #250 | Tragic 6.0% |
| Tlingit-Haida | 0.2 /100 | #251 | Tragic 6.0% |