Thai vs Egyptian Unemployment Among Women with Children Ages 6 to 17 years
COMPARE
Thai
Egyptian
Unemployment Among Women with Children Ages 6 to 17 years
Unemployment Among Women with Children Ages 6 to 17 years Comparison
Thais
Egyptians
7.8%
UNEMPLOYMENT AMONG WOMEN WITH CHILDREN AGES 6 TO 17 YEARS
100.0/ 100
METRIC RATING
29th/ 347
METRIC RANK
8.7%
UNEMPLOYMENT AMONG WOMEN WITH CHILDREN AGES 6 TO 17 YEARS
91.8/ 100
METRIC RATING
133rd/ 347
METRIC RANK
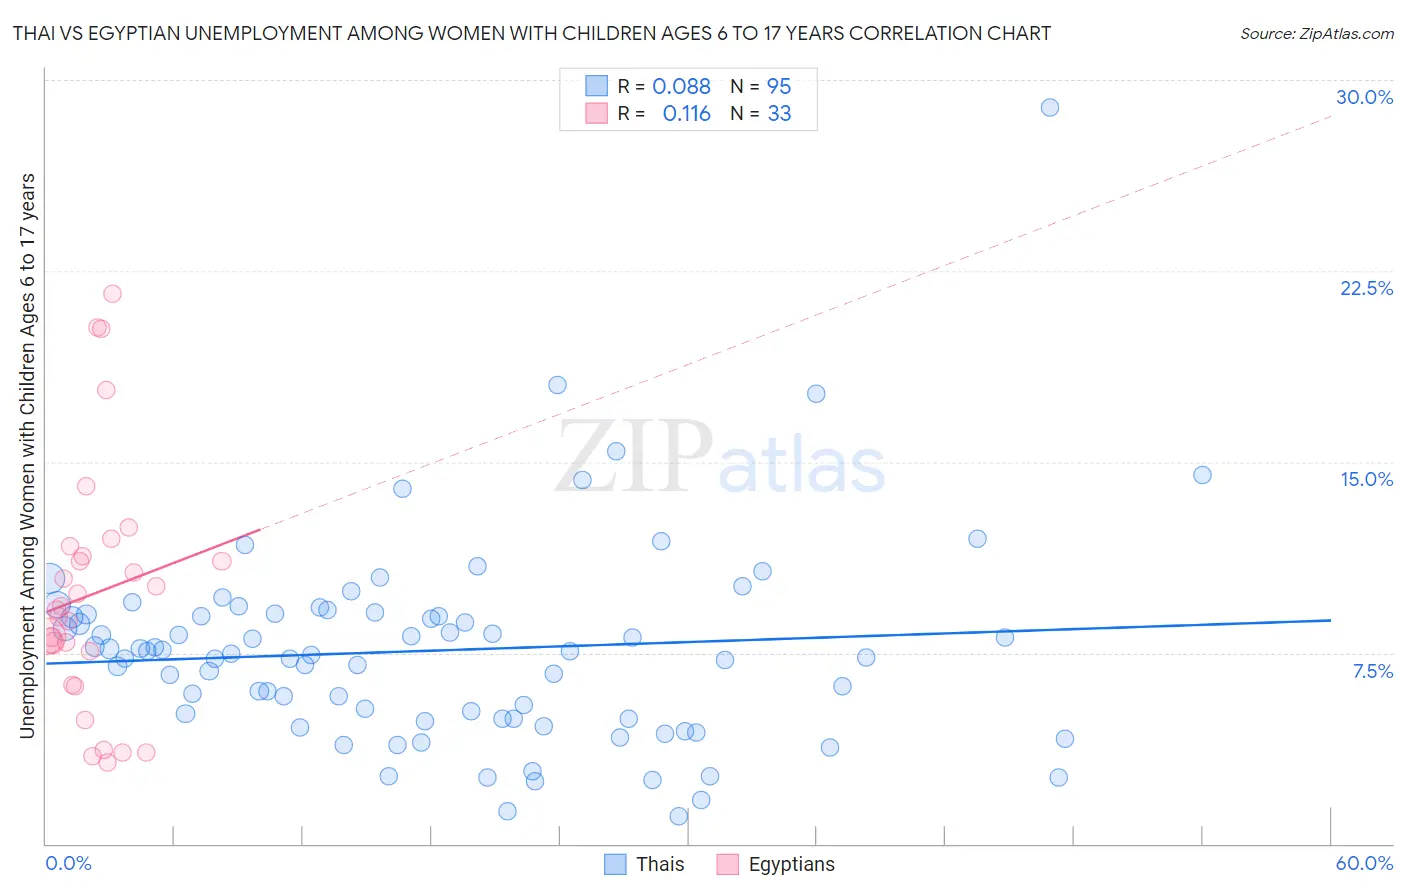
Thai vs Egyptian Unemployment Among Women with Children Ages 6 to 17 years Correlation Chart
The statistical analysis conducted on geographies consisting of 328,573,695 people shows a slight positive correlation between the proportion of Thais and unemployment rate among women with children between the ages 6 and 17 in the United States with a correlation coefficient (R) of 0.088 and weighted average of 7.8%. Similarly, the statistical analysis conducted on geographies consisting of 213,857,106 people shows a poor positive correlation between the proportion of Egyptians and unemployment rate among women with children between the ages 6 and 17 in the United States with a correlation coefficient (R) of 0.116 and weighted average of 8.7%, a difference of 11.5%.
Unemployment Among Women with Children Ages 6 to 17 years Correlation Summary
| Measurement | Thai | Egyptian |
| Minimum | 1.1% | 3.2% |
| Maximum | 28.9% | 21.6% |
| Range | 27.8% | 18.4% |
| Mean | 7.6% | 9.8% |
| Median | 7.5% | 9.2% |
| Interquartile 25% (IQ1) | 4.9% | 6.9% |
| Interquartile 75% (IQ3) | 9.0% | 11.5% |
| Interquartile Range (IQR) | 4.1% | 4.6% |
| Standard Deviation (Sample) | 4.0% | 4.8% |
| Standard Deviation (Population) | 4.0% | 4.7% |
Similar Demographics by Unemployment Among Women with Children Ages 6 to 17 years
Demographics Similar to Thais by Unemployment Among Women with Children Ages 6 to 17 years
In terms of unemployment among women with children ages 6 to 17 years, the demographic groups most similar to Thais are Immigrants from Uzbekistan (7.8%, a difference of 0.34%), Immigrants from Afghanistan (7.8%, a difference of 0.67%), Immigrants from Iran (7.9%, a difference of 0.89%), Laotian (7.9%, a difference of 1.1%), and Immigrants from Cambodia (7.9%, a difference of 1.1%).
| Demographics | Rating | Rank | Unemployment Among Women with Children Ages 6 to 17 years |
| Immigrants | China | 100.0 /100 | #22 | Exceptional 7.7% |
| Immigrants | Indonesia | 100.0 /100 | #23 | Exceptional 7.7% |
| Nepalese | 100.0 /100 | #24 | Exceptional 7.7% |
| Immigrants | Eastern Asia | 100.0 /100 | #25 | Exceptional 7.7% |
| Indians (Asian) | 100.0 /100 | #26 | Exceptional 7.7% |
| Immigrants | Afghanistan | 100.0 /100 | #27 | Exceptional 7.8% |
| Immigrants | Uzbekistan | 100.0 /100 | #28 | Exceptional 7.8% |
| Thais | 100.0 /100 | #29 | Exceptional 7.8% |
| Immigrants | Iran | 100.0 /100 | #30 | Exceptional 7.9% |
| Laotians | 100.0 /100 | #31 | Exceptional 7.9% |
| Immigrants | Cambodia | 100.0 /100 | #32 | Exceptional 7.9% |
| Immigrants | Korea | 100.0 /100 | #33 | Exceptional 7.9% |
| Native Hawaiians | 100.0 /100 | #34 | Exceptional 7.9% |
| Immigrants | South Central Asia | 100.0 /100 | #35 | Exceptional 7.9% |
| Burmese | 100.0 /100 | #36 | Exceptional 8.0% |
Demographics Similar to Egyptians by Unemployment Among Women with Children Ages 6 to 17 years
In terms of unemployment among women with children ages 6 to 17 years, the demographic groups most similar to Egyptians are Yaqui (8.7%, a difference of 0.060%), Slavic (8.7%, a difference of 0.070%), Immigrants from Ireland (8.7%, a difference of 0.11%), European (8.7%, a difference of 0.17%), and Immigrants from Latvia (8.7%, a difference of 0.20%).
| Demographics | Rating | Rank | Unemployment Among Women with Children Ages 6 to 17 years |
| Immigrants | Northern Africa | 94.4 /100 | #126 | Exceptional 8.7% |
| Czechs | 94.4 /100 | #127 | Exceptional 8.7% |
| Hmong | 94.3 /100 | #128 | Exceptional 8.7% |
| Barbadians | 93.8 /100 | #129 | Exceptional 8.7% |
| Immigrants | Western Asia | 93.1 /100 | #130 | Exceptional 8.7% |
| Slavs | 92.2 /100 | #131 | Exceptional 8.7% |
| Yaqui | 92.2 /100 | #132 | Exceptional 8.7% |
| Egyptians | 91.8 /100 | #133 | Exceptional 8.7% |
| Immigrants | Ireland | 91.0 /100 | #134 | Exceptional 8.7% |
| Europeans | 90.6 /100 | #135 | Exceptional 8.7% |
| Immigrants | Latvia | 90.4 /100 | #136 | Exceptional 8.7% |
| Immigrants | Argentina | 90.0 /100 | #137 | Excellent 8.7% |
| Immigrants | Ethiopia | 89.5 /100 | #138 | Excellent 8.8% |
| Northern Europeans | 89.2 /100 | #139 | Excellent 8.8% |
| Immigrants | Poland | 88.3 /100 | #140 | Excellent 8.8% |