Taiwanese vs Colombian Unemployment Among Women with Children Under 6 years
COMPARE
Taiwanese
Colombian
Unemployment Among Women with Children Under 6 years
Unemployment Among Women with Children Under 6 years Comparison
Taiwanese
Colombians
6.1%
UNEMPLOYMENT AMONG WOMEN WITH CHILDREN UNDER 6 YEARS
100.0/ 100
METRIC RATING
7th/ 347
METRIC RANK
7.5%
UNEMPLOYMENT AMONG WOMEN WITH CHILDREN UNDER 6 YEARS
76.1/ 100
METRIC RATING
149th/ 347
METRIC RANK
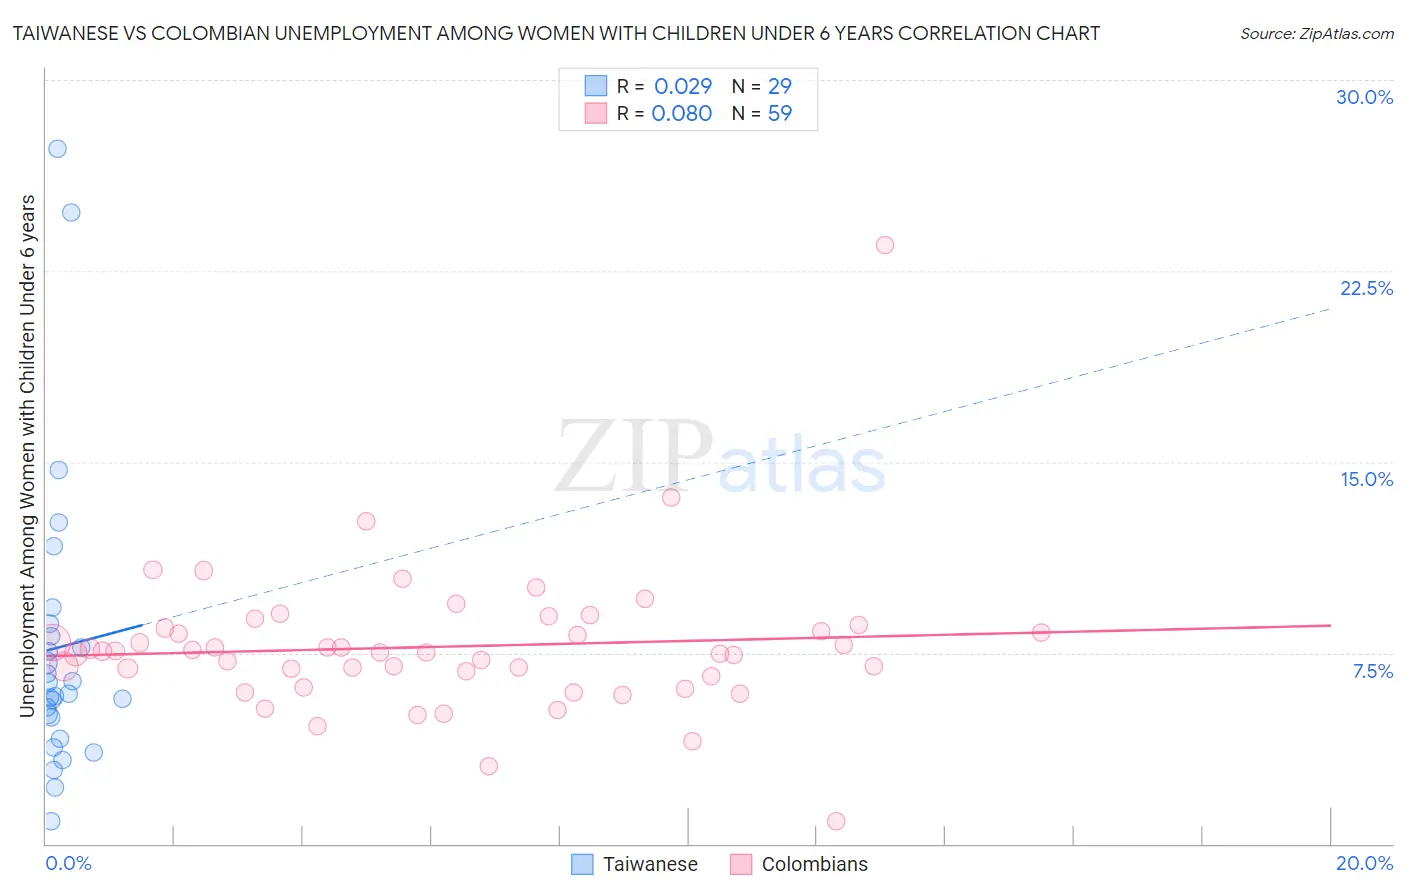
Taiwanese vs Colombian Unemployment Among Women with Children Under 6 years Correlation Chart
The statistical analysis conducted on geographies consisting of 30,738,294 people shows no correlation between the proportion of Taiwanese and unemployment rate among women with children under the age of 6 in the United States with a correlation coefficient (R) of 0.029 and weighted average of 6.1%. Similarly, the statistical analysis conducted on geographies consisting of 319,026,825 people shows a slight positive correlation between the proportion of Colombians and unemployment rate among women with children under the age of 6 in the United States with a correlation coefficient (R) of 0.080 and weighted average of 7.5%, a difference of 23.4%.
Unemployment Among Women with Children Under 6 years Correlation Summary
| Measurement | Taiwanese | Colombian |
| Minimum | 0.90% | 0.90% |
| Maximum | 27.3% | 23.5% |
| Range | 26.4% | 22.6% |
| Mean | 7.7% | 7.7% |
| Median | 5.9% | 7.5% |
| Interquartile 25% (IQ1) | 4.5% | 6.6% |
| Interquartile 75% (IQ3) | 8.4% | 8.5% |
| Interquartile Range (IQR) | 3.9% | 1.9% |
| Standard Deviation (Sample) | 5.9% | 2.9% |
| Standard Deviation (Population) | 5.8% | 2.9% |
Similar Demographics by Unemployment Among Women with Children Under 6 years
Demographics Similar to Taiwanese by Unemployment Among Women with Children Under 6 years
In terms of unemployment among women with children under 6 years, the demographic groups most similar to Taiwanese are Immigrants from India (6.1%, a difference of 0.49%), Immigrants from Taiwan (6.0%, a difference of 0.52%), Filipino (6.1%, a difference of 0.94%), Cape Verdean (5.9%, a difference of 2.2%), and Immigrants from China (6.2%, a difference of 2.4%).
| Demographics | Rating | Rank | Unemployment Among Women with Children Under 6 years |
| Immigrants | Cabo Verde | 100.0 /100 | #1 | Exceptional 5.4% |
| Immigrants | Hong Kong | 100.0 /100 | #2 | Exceptional 5.8% |
| Okinawans | 100.0 /100 | #3 | Exceptional 5.8% |
| Cambodians | 100.0 /100 | #4 | Exceptional 5.9% |
| Cape Verdeans | 100.0 /100 | #5 | Exceptional 5.9% |
| Immigrants | Taiwan | 100.0 /100 | #6 | Exceptional 6.0% |
| Taiwanese | 100.0 /100 | #7 | Exceptional 6.1% |
| Immigrants | India | 100.0 /100 | #8 | Exceptional 6.1% |
| Filipinos | 100.0 /100 | #9 | Exceptional 6.1% |
| Immigrants | China | 100.0 /100 | #10 | Exceptional 6.2% |
| Indians (Asian) | 100.0 /100 | #11 | Exceptional 6.3% |
| Immigrants | Singapore | 100.0 /100 | #12 | Exceptional 6.3% |
| Immigrants | Eastern Asia | 100.0 /100 | #13 | Exceptional 6.3% |
| Immigrants | Bulgaria | 100.0 /100 | #14 | Exceptional 6.3% |
| Thais | 100.0 /100 | #15 | Exceptional 6.3% |
Demographics Similar to Colombians by Unemployment Among Women with Children Under 6 years
In terms of unemployment among women with children under 6 years, the demographic groups most similar to Colombians are Aleut (7.5%, a difference of 0.010%), Immigrants from Peru (7.5%, a difference of 0.11%), Bangladeshi (7.5%, a difference of 0.11%), Immigrants from Brazil (7.5%, a difference of 0.12%), and Uruguayan (7.5%, a difference of 0.12%).
| Demographics | Rating | Rank | Unemployment Among Women with Children Under 6 years |
| Immigrants | Argentina | 81.5 /100 | #142 | Excellent 7.5% |
| Koreans | 81.3 /100 | #143 | Excellent 7.5% |
| Europeans | 79.1 /100 | #144 | Good 7.5% |
| Immigrants | Jordan | 78.9 /100 | #145 | Good 7.5% |
| Japanese | 78.9 /100 | #146 | Good 7.5% |
| Immigrants | Oceania | 78.4 /100 | #147 | Good 7.5% |
| Immigrants | Brazil | 77.3 /100 | #148 | Good 7.5% |
| Colombians | 76.1 /100 | #149 | Good 7.5% |
| Aleuts | 76.0 /100 | #150 | Good 7.5% |
| Immigrants | Peru | 74.9 /100 | #151 | Good 7.5% |
| Bangladeshis | 74.8 /100 | #152 | Good 7.5% |
| Uruguayans | 74.7 /100 | #153 | Good 7.5% |
| Northern Europeans | 74.3 /100 | #154 | Good 7.5% |
| South Americans | 74.1 /100 | #155 | Good 7.5% |
| Immigrants | Southern Europe | 73.2 /100 | #156 | Good 7.5% |