Taiwanese vs Nicaraguan Unemployment Among Youth under 25 years
COMPARE
Taiwanese
Nicaraguan
Unemployment Among Youth under 25 years
Unemployment Among Youth under 25 years Comparison
Taiwanese
Nicaraguans
10.8%
UNEMPLOYMENT AMONG YOUTH UNDER 25 YEARS
99.9/ 100
METRIC RATING
32nd/ 347
METRIC RANK
11.3%
UNEMPLOYMENT AMONG YOUTH UNDER 25 YEARS
94.3/ 100
METRIC RATING
97th/ 347
METRIC RANK
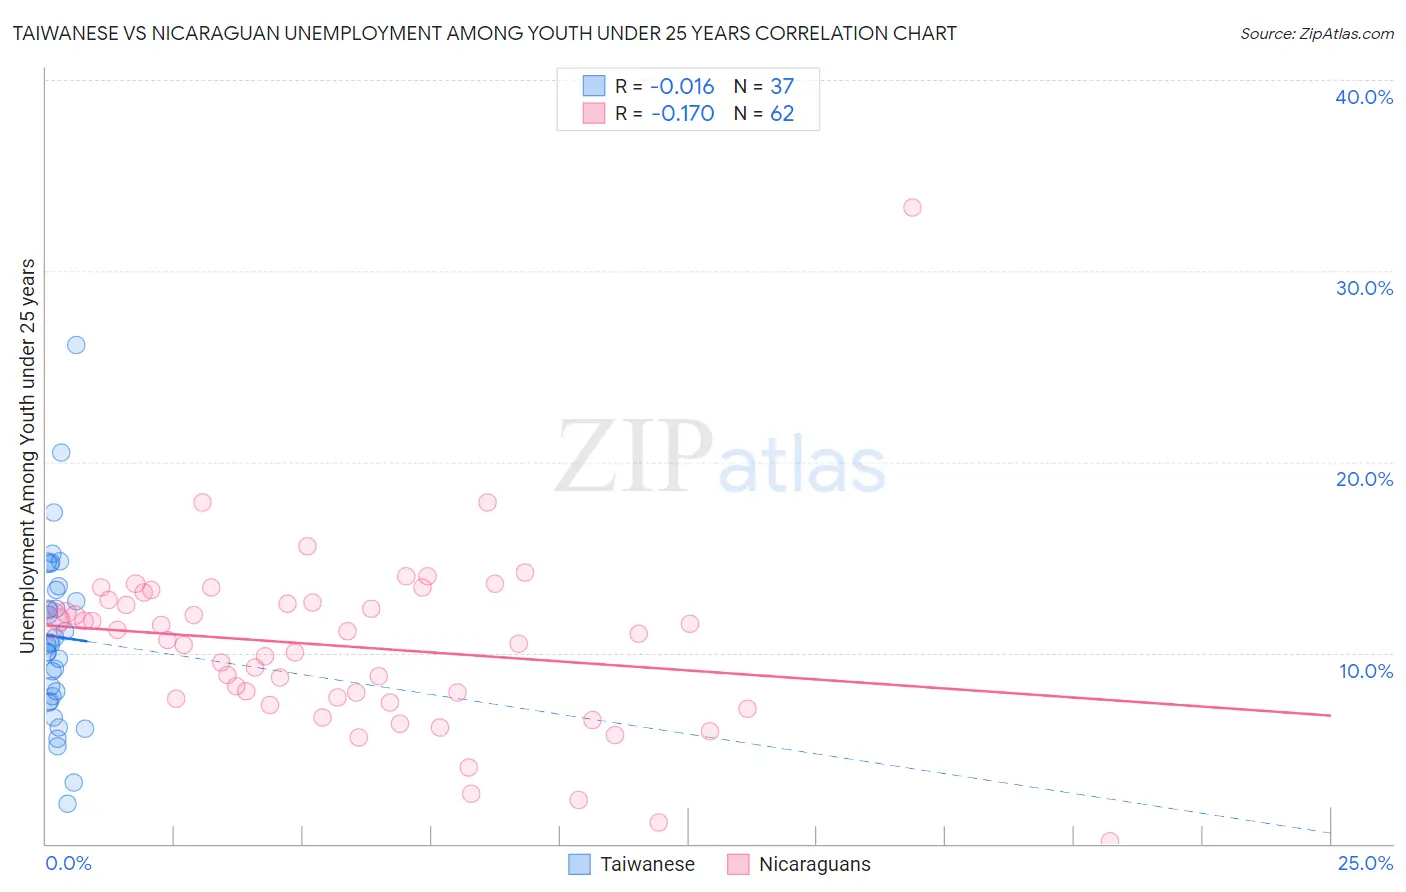
Taiwanese vs Nicaraguan Unemployment Among Youth under 25 years Correlation Chart
The statistical analysis conducted on geographies consisting of 31,706,406 people shows no correlation between the proportion of Taiwanese and unemployment rate among youth under the age of 25 in the United States with a correlation coefficient (R) of -0.016 and weighted average of 10.8%. Similarly, the statistical analysis conducted on geographies consisting of 284,206,393 people shows a poor negative correlation between the proportion of Nicaraguans and unemployment rate among youth under the age of 25 in the United States with a correlation coefficient (R) of -0.170 and weighted average of 11.3%, a difference of 4.8%.
Unemployment Among Youth under 25 years Correlation Summary
| Measurement | Taiwanese | Nicaraguan |
| Minimum | 2.1% | 0.10% |
| Maximum | 26.1% | 33.3% |
| Range | 24.0% | 33.2% |
| Mean | 10.8% | 10.3% |
| Median | 10.5% | 10.8% |
| Interquartile 25% (IQ1) | 7.6% | 7.6% |
| Interquartile 75% (IQ3) | 13.4% | 12.7% |
| Interquartile Range (IQR) | 5.8% | 5.1% |
| Standard Deviation (Sample) | 4.7% | 4.8% |
| Standard Deviation (Population) | 4.6% | 4.7% |
Similar Demographics by Unemployment Among Youth under 25 years
Demographics Similar to Taiwanese by Unemployment Among Youth under 25 years
In terms of unemployment among youth under 25 years, the demographic groups most similar to Taiwanese are European (10.8%, a difference of 0.22%), Slovene (10.7%, a difference of 0.26%), Osage (10.7%, a difference of 0.37%), Chinese (10.7%, a difference of 0.44%), and English (10.8%, a difference of 0.50%).
| Demographics | Rating | Rank | Unemployment Among Youth under 25 years |
| Immigrants | North Macedonia | 100.0 /100 | #25 | Exceptional 10.7% |
| Immigrants | India | 100.0 /100 | #26 | Exceptional 10.7% |
| Yugoslavians | 100.0 /100 | #27 | Exceptional 10.7% |
| Somalis | 100.0 /100 | #28 | Exceptional 10.7% |
| Chinese | 99.9 /100 | #29 | Exceptional 10.7% |
| Osage | 99.9 /100 | #30 | Exceptional 10.7% |
| Slovenes | 99.9 /100 | #31 | Exceptional 10.7% |
| Taiwanese | 99.9 /100 | #32 | Exceptional 10.8% |
| Europeans | 99.9 /100 | #33 | Exceptional 10.8% |
| English | 99.9 /100 | #34 | Exceptional 10.8% |
| Immigrants | Nepal | 99.9 /100 | #35 | Exceptional 10.8% |
| Hmong | 99.8 /100 | #36 | Exceptional 10.8% |
| Immigrants | Zimbabwe | 99.8 /100 | #37 | Exceptional 10.8% |
| Immigrants | Congo | 99.8 /100 | #38 | Exceptional 10.9% |
| Immigrants | Zaire | 99.8 /100 | #39 | Exceptional 10.9% |
Demographics Similar to Nicaraguans by Unemployment Among Youth under 25 years
In terms of unemployment among youth under 25 years, the demographic groups most similar to Nicaraguans are Estonian (11.3%, a difference of 0.0%), Immigrants from Serbia (11.3%, a difference of 0.020%), Carpatho Rusyn (11.3%, a difference of 0.030%), Celtic (11.3%, a difference of 0.050%), and Pakistani (11.3%, a difference of 0.060%).
| Demographics | Rating | Rank | Unemployment Among Youth under 25 years |
| Immigrants | Bolivia | 95.5 /100 | #90 | Exceptional 11.2% |
| Immigrants | Taiwan | 95.1 /100 | #91 | Exceptional 11.2% |
| Immigrants | Latvia | 95.1 /100 | #92 | Exceptional 11.2% |
| Immigrants | North America | 95.1 /100 | #93 | Exceptional 11.2% |
| Lithuanians | 94.8 /100 | #94 | Exceptional 11.3% |
| Carpatho Rusyns | 94.4 /100 | #95 | Exceptional 11.3% |
| Immigrants | Serbia | 94.4 /100 | #96 | Exceptional 11.3% |
| Nicaraguans | 94.3 /100 | #97 | Exceptional 11.3% |
| Estonians | 94.2 /100 | #98 | Exceptional 11.3% |
| Celtics | 94.0 /100 | #99 | Exceptional 11.3% |
| Pakistanis | 94.0 /100 | #100 | Exceptional 11.3% |
| Iroquois | 93.8 /100 | #101 | Exceptional 11.3% |
| Immigrants | Thailand | 93.6 /100 | #102 | Exceptional 11.3% |
| Immigrants | Malaysia | 93.6 /100 | #103 | Exceptional 11.3% |
| Immigrants | Afghanistan | 93.4 /100 | #104 | Exceptional 11.3% |