Taiwanese vs Cajun Unemployment Among Women with Children Under 18 years
COMPARE
Taiwanese
Cajun
Unemployment Among Women with Children Under 18 years
Unemployment Among Women with Children Under 18 years Comparison
Taiwanese
Cajuns
4.8%
UNEMPLOYMENT AMONG WOMEN WITH CHILDREN UNDER 18 YEARS
99.8/ 100
METRIC RATING
16th/ 347
METRIC RANK
6.2%
UNEMPLOYMENT AMONG WOMEN WITH CHILDREN UNDER 18 YEARS
0.1/ 100
METRIC RATING
269th/ 347
METRIC RANK
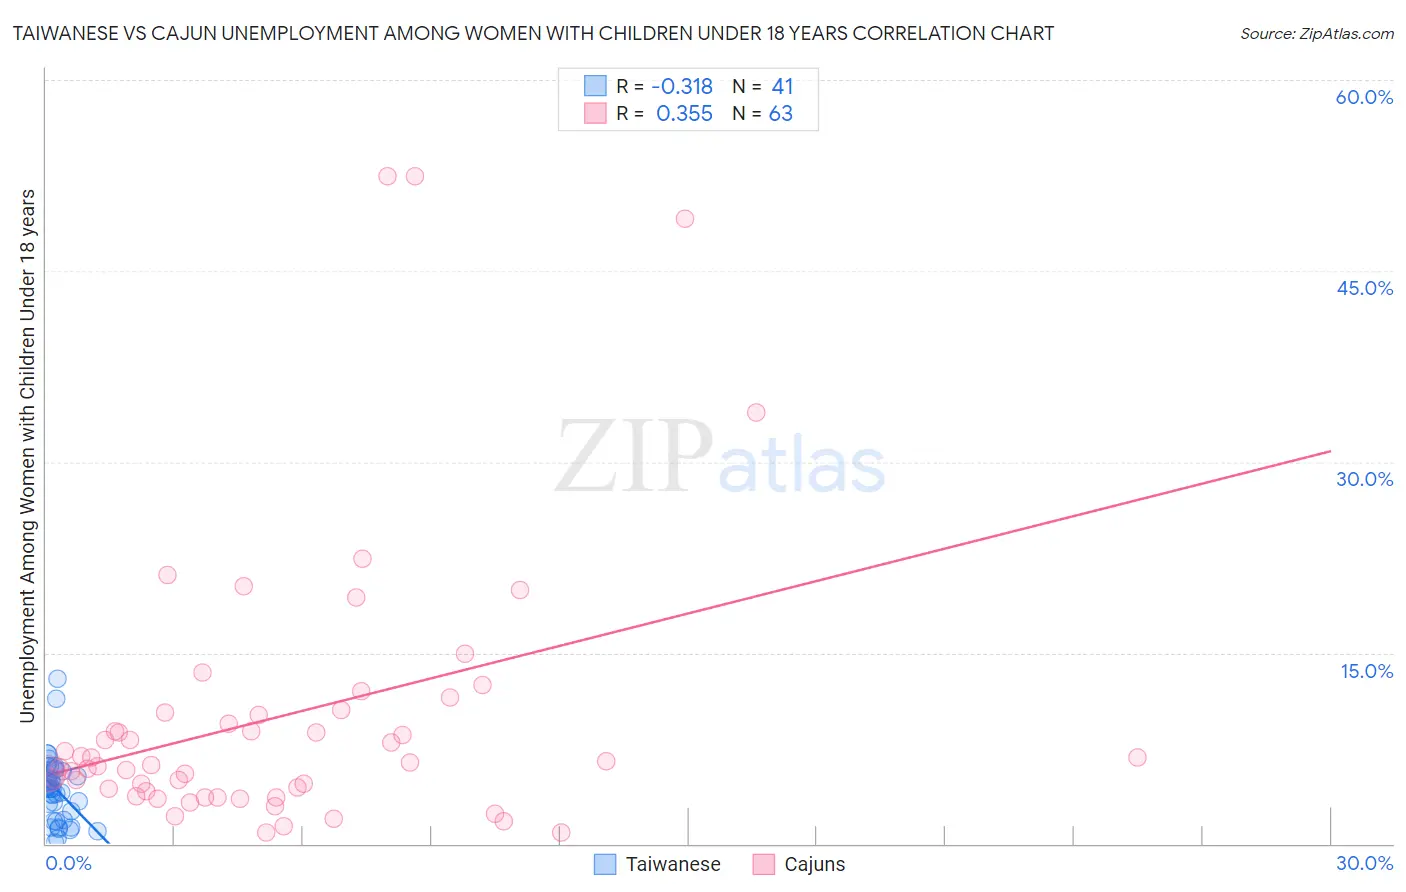
Taiwanese vs Cajun Unemployment Among Women with Children Under 18 years Correlation Chart
The statistical analysis conducted on geographies consisting of 31,614,590 people shows a mild negative correlation between the proportion of Taiwanese and unemployment rate among women with children under the age of 18 in the United States with a correlation coefficient (R) of -0.318 and weighted average of 4.8%. Similarly, the statistical analysis conducted on geographies consisting of 145,815,620 people shows a mild positive correlation between the proportion of Cajuns and unemployment rate among women with children under the age of 18 in the United States with a correlation coefficient (R) of 0.355 and weighted average of 6.2%, a difference of 27.5%.
Unemployment Among Women with Children Under 18 years Correlation Summary
| Measurement | Taiwanese | Cajun |
| Minimum | 0.10% | 0.90% |
| Maximum | 13.0% | 52.4% |
| Range | 12.9% | 51.5% |
| Mean | 4.2% | 10.0% |
| Median | 4.3% | 6.4% |
| Interquartile 25% (IQ1) | 1.8% | 4.1% |
| Interquartile 75% (IQ3) | 5.7% | 10.3% |
| Interquartile Range (IQR) | 3.9% | 6.2% |
| Standard Deviation (Sample) | 2.7% | 11.1% |
| Standard Deviation (Population) | 2.6% | 11.0% |
Similar Demographics by Unemployment Among Women with Children Under 18 years
Demographics Similar to Taiwanese by Unemployment Among Women with Children Under 18 years
In terms of unemployment among women with children under 18 years, the demographic groups most similar to Taiwanese are Immigrants from Singapore (4.9%, a difference of 0.20%), Slovene (4.9%, a difference of 0.31%), Thai (4.8%, a difference of 0.46%), German (4.9%, a difference of 0.46%), and Latvian (4.9%, a difference of 0.58%).
| Demographics | Rating | Rank | Unemployment Among Women with Children Under 18 years |
| Okinawans | 99.9 /100 | #9 | Exceptional 4.7% |
| Czechs | 99.9 /100 | #10 | Exceptional 4.7% |
| Filipinos | 99.9 /100 | #11 | Exceptional 4.8% |
| Scandinavians | 99.9 /100 | #12 | Exceptional 4.8% |
| Bulgarians | 99.9 /100 | #13 | Exceptional 4.8% |
| Cambodians | 99.9 /100 | #14 | Exceptional 4.8% |
| Thais | 99.8 /100 | #15 | Exceptional 4.8% |
| Taiwanese | 99.8 /100 | #16 | Exceptional 4.8% |
| Immigrants | Singapore | 99.8 /100 | #17 | Exceptional 4.9% |
| Slovenes | 99.8 /100 | #18 | Exceptional 4.9% |
| Germans | 99.8 /100 | #19 | Exceptional 4.9% |
| Latvians | 99.7 /100 | #20 | Exceptional 4.9% |
| Europeans | 99.6 /100 | #21 | Exceptional 4.9% |
| Indians (Asian) | 99.6 /100 | #22 | Exceptional 4.9% |
| Immigrants | China | 99.6 /100 | #23 | Exceptional 4.9% |
Demographics Similar to Cajuns by Unemployment Among Women with Children Under 18 years
In terms of unemployment among women with children under 18 years, the demographic groups most similar to Cajuns are Ghanaian (6.2%, a difference of 0.0%), Trinidadian and Tobagonian (6.2%, a difference of 0.040%), French American Indian (6.2%, a difference of 0.050%), Subsaharan African (6.2%, a difference of 0.070%), and Central American (6.2%, a difference of 0.30%).
| Demographics | Rating | Rank | Unemployment Among Women with Children Under 18 years |
| Immigrants | Trinidad and Tobago | 0.1 /100 | #262 | Tragic 6.1% |
| Spanish American Indians | 0.1 /100 | #263 | Tragic 6.1% |
| Comanche | 0.1 /100 | #264 | Tragic 6.1% |
| Immigrants | Bahamas | 0.1 /100 | #265 | Tragic 6.1% |
| Sub-Saharan Africans | 0.1 /100 | #266 | Tragic 6.2% |
| French American Indians | 0.1 /100 | #267 | Tragic 6.2% |
| Trinidadians and Tobagonians | 0.1 /100 | #268 | Tragic 6.2% |
| Cajuns | 0.1 /100 | #269 | Tragic 6.2% |
| Ghanaians | 0.1 /100 | #270 | Tragic 6.2% |
| Central Americans | 0.0 /100 | #271 | Tragic 6.2% |
| Salvadorans | 0.0 /100 | #272 | Tragic 6.2% |
| Immigrants | Western Africa | 0.0 /100 | #273 | Tragic 6.2% |
| Senegalese | 0.0 /100 | #274 | Tragic 6.2% |
| Dutch West Indians | 0.0 /100 | #275 | Tragic 6.2% |
| Immigrants | Ghana | 0.0 /100 | #276 | Tragic 6.2% |