Swedish vs Carpatho Rusyn Unemployment Among Seniors over 75 years
COMPARE
Swedish
Carpatho Rusyn
Unemployment Among Seniors over 75 years
Unemployment Among Seniors over 75 years Comparison
Swedes
Carpatho Rusyns
10.0%
UNEMPLOYMENT AMONG SENIORS OVER 75 YEARS
0.0/ 100
METRIC RATING
305th/ 347
METRIC RANK
9.7%
UNEMPLOYMENT AMONG SENIORS OVER 75 YEARS
0.0/ 100
METRIC RATING
285th/ 347
METRIC RANK
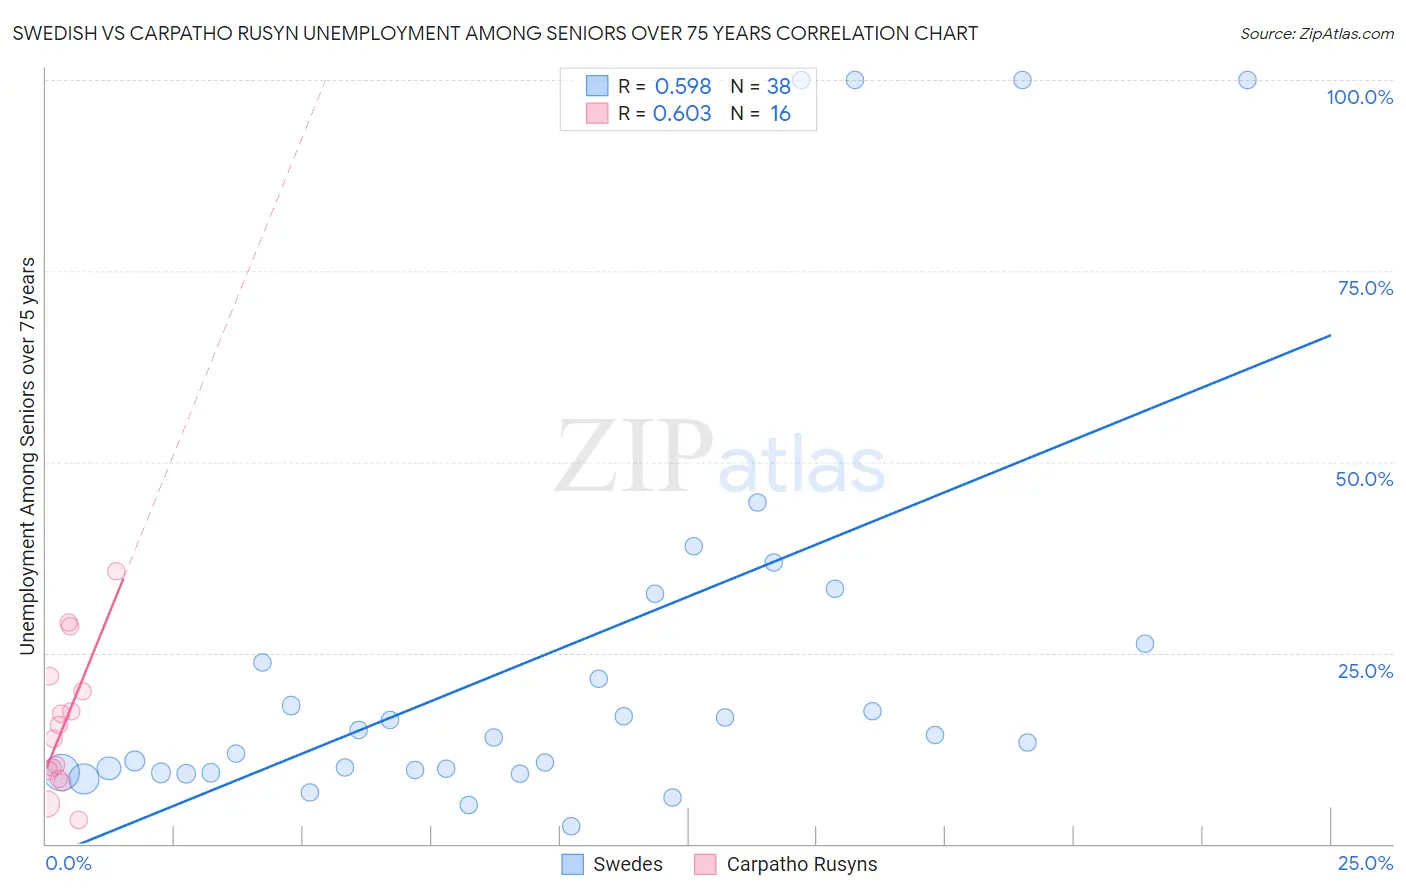
Swedish vs Carpatho Rusyn Unemployment Among Seniors over 75 years Correlation Chart
The statistical analysis conducted on geographies consisting of 229,693,656 people shows a substantial positive correlation between the proportion of Swedes and unemployment rate among seniors over the age of 75 in the United States with a correlation coefficient (R) of 0.598 and weighted average of 10.0%. Similarly, the statistical analysis conducted on geographies consisting of 46,670,878 people shows a significant positive correlation between the proportion of Carpatho Rusyns and unemployment rate among seniors over the age of 75 in the United States with a correlation coefficient (R) of 0.603 and weighted average of 9.7%, a difference of 3.4%.
Unemployment Among Seniors over 75 years Correlation Summary
| Measurement | Swedish | Carpatho Rusyn |
| Minimum | 2.3% | 3.1% |
| Maximum | 100.0% | 35.7% |
| Range | 97.7% | 32.6% |
| Mean | 24.9% | 15.8% |
| Median | 14.1% | 14.6% |
| Interquartile 25% (IQ1) | 9.4% | 9.1% |
| Interquartile 75% (IQ3) | 26.2% | 20.9% |
| Interquartile Range (IQR) | 16.8% | 11.9% |
| Standard Deviation (Sample) | 27.9% | 9.2% |
| Standard Deviation (Population) | 27.5% | 9.0% |
Demographics Similar to Swedes and Carpatho Rusyns by Unemployment Among Seniors over 75 years
In terms of unemployment among seniors over 75 years, the demographic groups most similar to Swedes are Scotch-Irish (10.0%, a difference of 0.19%), Puget Sound Salish (10.0%, a difference of 0.20%), Finnish (10.0%, a difference of 0.27%), Welsh (10.0%, a difference of 0.38%), and Iraqi (9.9%, a difference of 0.80%). Similarly, the demographic groups most similar to Carpatho Rusyns are Nigerian (9.7%, a difference of 0.060%), Danish (9.7%, a difference of 0.17%), Canadian (9.7%, a difference of 0.32%), Czech (9.7%, a difference of 0.39%), and Sioux (9.7%, a difference of 0.46%).
| Demographics | Rating | Rank | Unemployment Among Seniors over 75 years |
| Carpatho Rusyns | 0.0 /100 | #285 | Tragic 9.7% |
| Nigerians | 0.0 /100 | #286 | Tragic 9.7% |
| Danes | 0.0 /100 | #287 | Tragic 9.7% |
| Canadians | 0.0 /100 | #288 | Tragic 9.7% |
| Czechs | 0.0 /100 | #289 | Tragic 9.7% |
| Sioux | 0.0 /100 | #290 | Tragic 9.7% |
| Scandinavians | 0.0 /100 | #291 | Tragic 9.7% |
| Immigrants | Western Africa | 0.0 /100 | #292 | Tragic 9.8% |
| Norwegians | 0.0 /100 | #293 | Tragic 9.8% |
| Immigrants | Dominica | 0.0 /100 | #294 | Tragic 9.8% |
| Immigrants | Nonimmigrants | 0.0 /100 | #295 | Tragic 9.8% |
| Immigrants | St. Vincent and the Grenadines | 0.0 /100 | #296 | Tragic 9.8% |
| Cherokee | 0.0 /100 | #297 | Tragic 9.8% |
| Lithuanians | 0.0 /100 | #298 | Tragic 9.9% |
| Belgians | 0.0 /100 | #299 | Tragic 9.9% |
| Iraqis | 0.0 /100 | #300 | Tragic 9.9% |
| Welsh | 0.0 /100 | #301 | Tragic 10.0% |
| Finns | 0.0 /100 | #302 | Tragic 10.0% |
| Puget Sound Salish | 0.0 /100 | #303 | Tragic 10.0% |
| Scotch-Irish | 0.0 /100 | #304 | Tragic 10.0% |
| Swedes | 0.0 /100 | #305 | Tragic 10.0% |