Immigrants from Laos vs Colombian Unemployment Among Women with Children Under 6 years
COMPARE
Immigrants from Laos
Colombian
Unemployment Among Women with Children Under 6 years
Unemployment Among Women with Children Under 6 years Comparison
Immigrants from Laos
Colombians
7.6%
UNEMPLOYMENT AMONG WOMEN WITH CHILDREN UNDER 6 YEARS
50.0/ 100
METRIC RATING
174th/ 347
METRIC RANK
7.5%
UNEMPLOYMENT AMONG WOMEN WITH CHILDREN UNDER 6 YEARS
76.1/ 100
METRIC RATING
149th/ 347
METRIC RANK
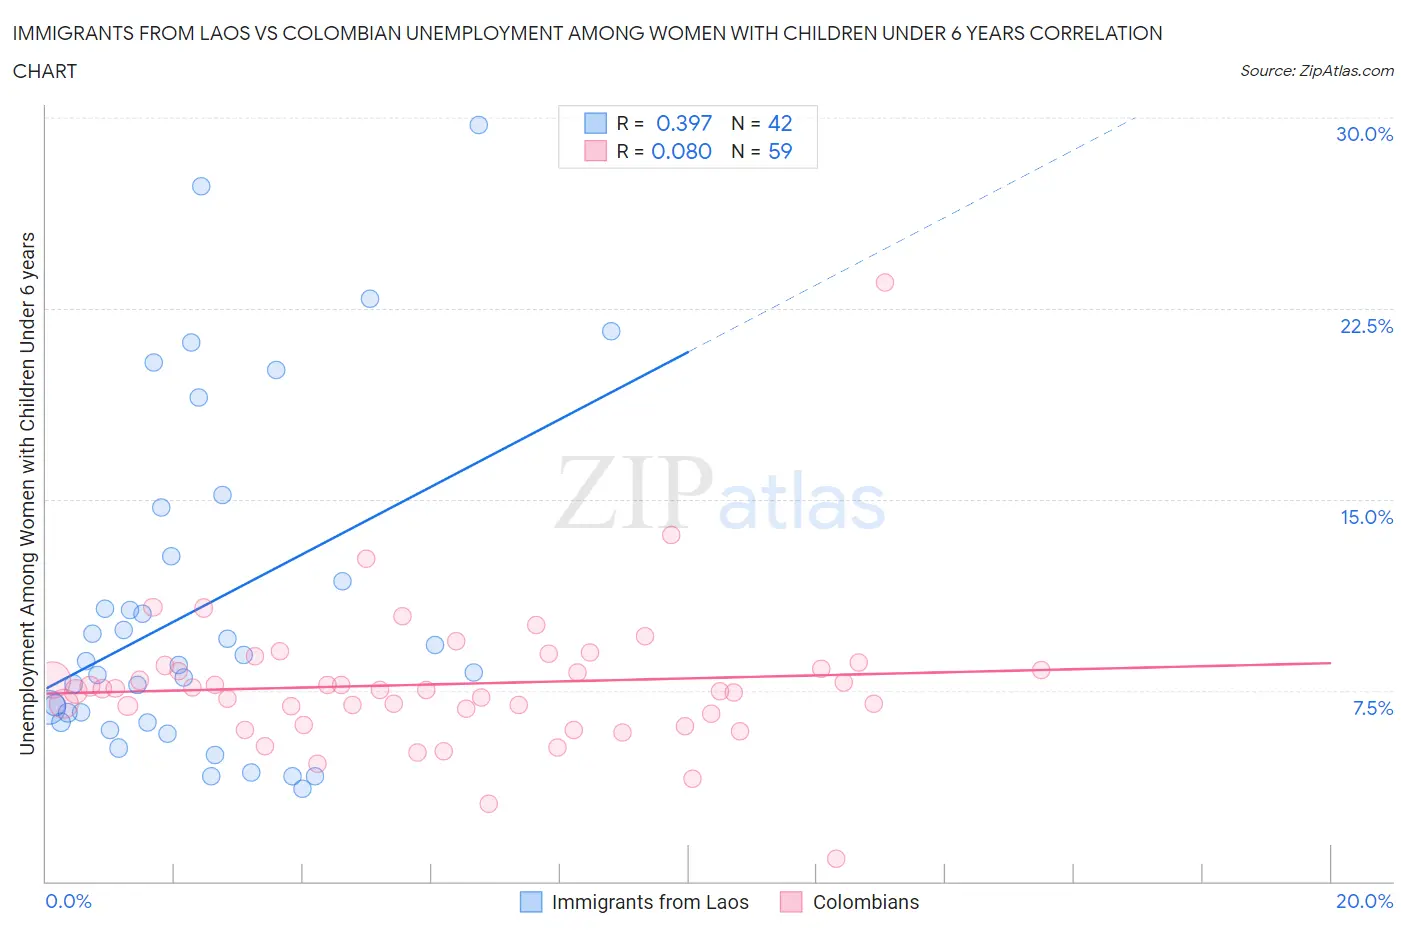
Immigrants from Laos vs Colombian Unemployment Among Women with Children Under 6 years Correlation Chart
The statistical analysis conducted on geographies consisting of 170,684,767 people shows a mild positive correlation between the proportion of Immigrants from Laos and unemployment rate among women with children under the age of 6 in the United States with a correlation coefficient (R) of 0.397 and weighted average of 7.6%. Similarly, the statistical analysis conducted on geographies consisting of 319,026,825 people shows a slight positive correlation between the proportion of Colombians and unemployment rate among women with children under the age of 6 in the United States with a correlation coefficient (R) of 0.080 and weighted average of 7.5%, a difference of 1.9%.
Unemployment Among Women with Children Under 6 years Correlation Summary
| Measurement | Immigrants from Laos | Colombian |
| Minimum | 3.7% | 0.90% |
| Maximum | 29.7% | 23.5% |
| Range | 26.0% | 22.6% |
| Mean | 10.8% | 7.7% |
| Median | 8.6% | 7.5% |
| Interquartile 25% (IQ1) | 6.3% | 6.6% |
| Interquartile 75% (IQ3) | 12.8% | 8.5% |
| Interquartile Range (IQR) | 6.5% | 1.9% |
| Standard Deviation (Sample) | 6.6% | 2.9% |
| Standard Deviation (Population) | 6.5% | 2.9% |
Similar Demographics by Unemployment Among Women with Children Under 6 years
Demographics Similar to Immigrants from Laos by Unemployment Among Women with Children Under 6 years
In terms of unemployment among women with children under 6 years, the demographic groups most similar to Immigrants from Laos are Panamanian (7.6%, a difference of 0.020%), Cree (7.6%, a difference of 0.11%), Puget Sound Salish (7.7%, a difference of 0.15%), Austrian (7.7%, a difference of 0.27%), and Immigrants from England (7.7%, a difference of 0.31%).
| Demographics | Rating | Rank | Unemployment Among Women with Children Under 6 years |
| Kenyans | 62.5 /100 | #167 | Good 7.6% |
| Immigrants | Canada | 61.6 /100 | #168 | Good 7.6% |
| Immigrants | Scotland | 61.3 /100 | #169 | Good 7.6% |
| Czechs | 59.8 /100 | #170 | Average 7.6% |
| Immigrants | Grenada | 59.0 /100 | #171 | Average 7.6% |
| Immigrants | North America | 57.7 /100 | #172 | Average 7.6% |
| Cree | 51.6 /100 | #173 | Average 7.6% |
| Immigrants | Laos | 50.0 /100 | #174 | Average 7.6% |
| Panamanians | 49.6 /100 | #175 | Average 7.6% |
| Puget Sound Salish | 47.7 /100 | #176 | Average 7.7% |
| Austrians | 46.0 /100 | #177 | Average 7.7% |
| Immigrants | England | 45.4 /100 | #178 | Average 7.7% |
| Immigrants | Western Europe | 44.9 /100 | #179 | Average 7.7% |
| Immigrants | Uruguay | 44.5 /100 | #180 | Average 7.7% |
| Brazilians | 43.9 /100 | #181 | Average 7.7% |
Demographics Similar to Colombians by Unemployment Among Women with Children Under 6 years
In terms of unemployment among women with children under 6 years, the demographic groups most similar to Colombians are Aleut (7.5%, a difference of 0.010%), Immigrants from Peru (7.5%, a difference of 0.11%), Bangladeshi (7.5%, a difference of 0.11%), Immigrants from Brazil (7.5%, a difference of 0.12%), and Uruguayan (7.5%, a difference of 0.12%).
| Demographics | Rating | Rank | Unemployment Among Women with Children Under 6 years |
| Immigrants | Argentina | 81.5 /100 | #142 | Excellent 7.5% |
| Koreans | 81.3 /100 | #143 | Excellent 7.5% |
| Europeans | 79.1 /100 | #144 | Good 7.5% |
| Immigrants | Jordan | 78.9 /100 | #145 | Good 7.5% |
| Japanese | 78.9 /100 | #146 | Good 7.5% |
| Immigrants | Oceania | 78.4 /100 | #147 | Good 7.5% |
| Immigrants | Brazil | 77.3 /100 | #148 | Good 7.5% |
| Colombians | 76.1 /100 | #149 | Good 7.5% |
| Aleuts | 76.0 /100 | #150 | Good 7.5% |
| Immigrants | Peru | 74.9 /100 | #151 | Good 7.5% |
| Bangladeshis | 74.8 /100 | #152 | Good 7.5% |
| Uruguayans | 74.7 /100 | #153 | Good 7.5% |
| Northern Europeans | 74.3 /100 | #154 | Good 7.5% |
| South Americans | 74.1 /100 | #155 | Good 7.5% |
| Immigrants | Southern Europe | 73.2 /100 | #156 | Good 7.5% |