Subsaharan African vs Immigrants from Singapore Female Unemployment
COMPARE
Subsaharan African
Immigrants from Singapore
Female Unemployment
Female Unemployment Comparison
Sub-Saharan Africans
Immigrants from Singapore
5.7%
FEMALE UNEMPLOYMENT
0.4/ 100
METRIC RATING
256th/ 347
METRIC RANK
5.0%
FEMALE UNEMPLOYMENT
98.0/ 100
METRIC RATING
75th/ 347
METRIC RANK
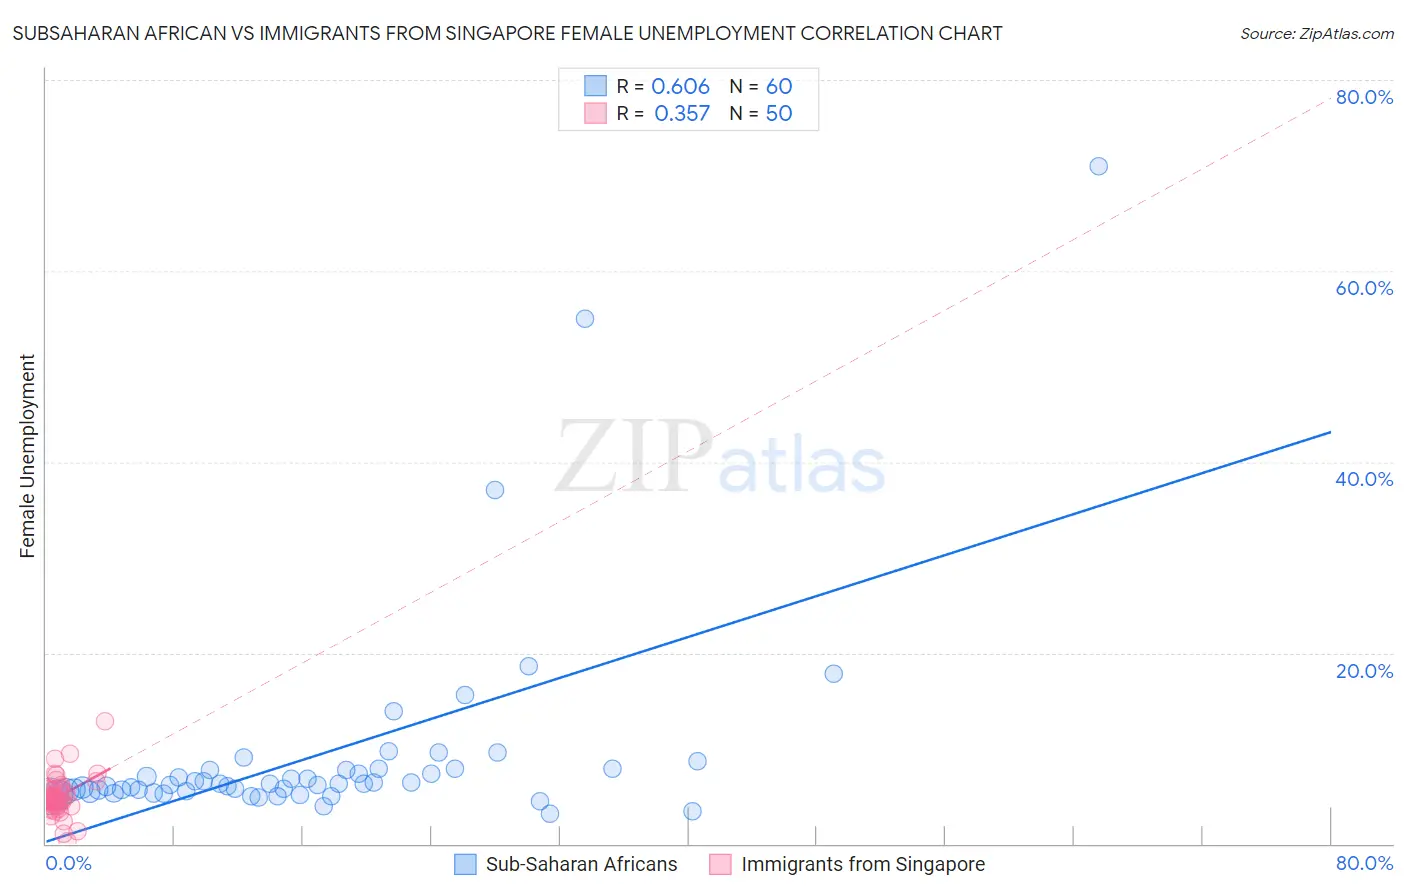
Subsaharan African vs Immigrants from Singapore Female Unemployment Correlation Chart
The statistical analysis conducted on geographies consisting of 503,774,253 people shows a significant positive correlation between the proportion of Sub-Saharan Africans and unemploymnet rate among females in the United States with a correlation coefficient (R) of 0.606 and weighted average of 5.7%. Similarly, the statistical analysis conducted on geographies consisting of 137,404,141 people shows a mild positive correlation between the proportion of Immigrants from Singapore and unemploymnet rate among females in the United States with a correlation coefficient (R) of 0.357 and weighted average of 5.0%, a difference of 15.1%.
Female Unemployment Correlation Summary
| Measurement | Subsaharan African | Immigrants from Singapore |
| Minimum | 3.1% | 0.30% |
| Maximum | 71.0% | 12.8% |
| Range | 67.9% | 12.5% |
| Mean | 9.3% | 4.9% |
| Median | 6.2% | 4.7% |
| Interquartile 25% (IQ1) | 5.5% | 4.1% |
| Interquartile 75% (IQ3) | 7.8% | 5.6% |
| Interquartile Range (IQR) | 2.3% | 1.5% |
| Standard Deviation (Sample) | 11.3% | 2.0% |
| Standard Deviation (Population) | 11.2% | 2.0% |
Similar Demographics by Female Unemployment
Demographics Similar to Sub-Saharan Africans by Female Unemployment
In terms of female unemployment, the demographic groups most similar to Sub-Saharan Africans are Dutch West Indian (5.7%, a difference of 0.070%), Immigrants from Cameroon (5.7%, a difference of 0.67%), Immigrants from Sierra Leone (5.7%, a difference of 0.71%), Immigrants (5.7%, a difference of 0.71%), and Cajun (5.7%, a difference of 0.85%).
| Demographics | Rating | Rank | Female Unemployment |
| Immigrants | Uzbekistan | 1.0 /100 | #249 | Tragic 5.6% |
| Immigrants | Syria | 0.8 /100 | #250 | Tragic 5.6% |
| Assyrians/Chaldeans/Syriacs | 0.8 /100 | #251 | Tragic 5.6% |
| Cajuns | 0.7 /100 | #252 | Tragic 5.7% |
| Immigrants | Sierra Leone | 0.6 /100 | #253 | Tragic 5.7% |
| Immigrants | Immigrants | 0.6 /100 | #254 | Tragic 5.7% |
| Immigrants | Cameroon | 0.6 /100 | #255 | Tragic 5.7% |
| Sub-Saharan Africans | 0.4 /100 | #256 | Tragic 5.7% |
| Dutch West Indians | 0.3 /100 | #257 | Tragic 5.7% |
| Immigrants | Portugal | 0.2 /100 | #258 | Tragic 5.8% |
| Immigrants | Fiji | 0.2 /100 | #259 | Tragic 5.8% |
| Nigerians | 0.2 /100 | #260 | Tragic 5.8% |
| Kiowa | 0.1 /100 | #261 | Tragic 5.8% |
| Immigrants | Nigeria | 0.1 /100 | #262 | Tragic 5.8% |
| Immigrants | Azores | 0.1 /100 | #263 | Tragic 5.8% |
Demographics Similar to Immigrants from Singapore by Female Unemployment
In terms of female unemployment, the demographic groups most similar to Immigrants from Singapore are Immigrants from Venezuela (5.0%, a difference of 0.010%), Immigrants from Bolivia (5.0%, a difference of 0.020%), Russian (5.0%, a difference of 0.030%), Immigrants from Northern Europe (4.9%, a difference of 0.060%), and Mongolian (5.0%, a difference of 0.10%).
| Demographics | Rating | Rank | Female Unemployment |
| Tlingit-Haida | 98.3 /100 | #68 | Exceptional 4.9% |
| Immigrants | Ireland | 98.2 /100 | #69 | Exceptional 4.9% |
| Osage | 98.2 /100 | #70 | Exceptional 4.9% |
| German Russians | 98.1 /100 | #71 | Exceptional 4.9% |
| Immigrants | Northern Europe | 98.0 /100 | #72 | Exceptional 4.9% |
| Russians | 98.0 /100 | #73 | Exceptional 5.0% |
| Immigrants | Bolivia | 98.0 /100 | #74 | Exceptional 5.0% |
| Immigrants | Singapore | 98.0 /100 | #75 | Exceptional 5.0% |
| Immigrants | Venezuela | 97.9 /100 | #76 | Exceptional 5.0% |
| Mongolians | 97.8 /100 | #77 | Exceptional 5.0% |
| Immigrants | Netherlands | 97.8 /100 | #78 | Exceptional 5.0% |
| Turks | 97.6 /100 | #79 | Exceptional 5.0% |
| New Zealanders | 97.4 /100 | #80 | Exceptional 5.0% |
| Filipinos | 97.3 /100 | #81 | Exceptional 5.0% |
| Immigrants | Australia | 97.3 /100 | #82 | Exceptional 5.0% |