Subsaharan African vs Portuguese Unemployment Among Seniors over 65 years
COMPARE
Subsaharan African
Portuguese
Unemployment Among Seniors over 65 years
Unemployment Among Seniors over 65 years Comparison
Sub-Saharan Africans
Portuguese
5.2%
UNEMPLOYMENT AMONG SENIORS OVER 65 YEARS
17.1/ 100
METRIC RATING
203rd/ 347
METRIC RANK
5.6%
UNEMPLOYMENT AMONG SENIORS OVER 65 YEARS
0.0/ 100
METRIC RATING
307th/ 347
METRIC RANK
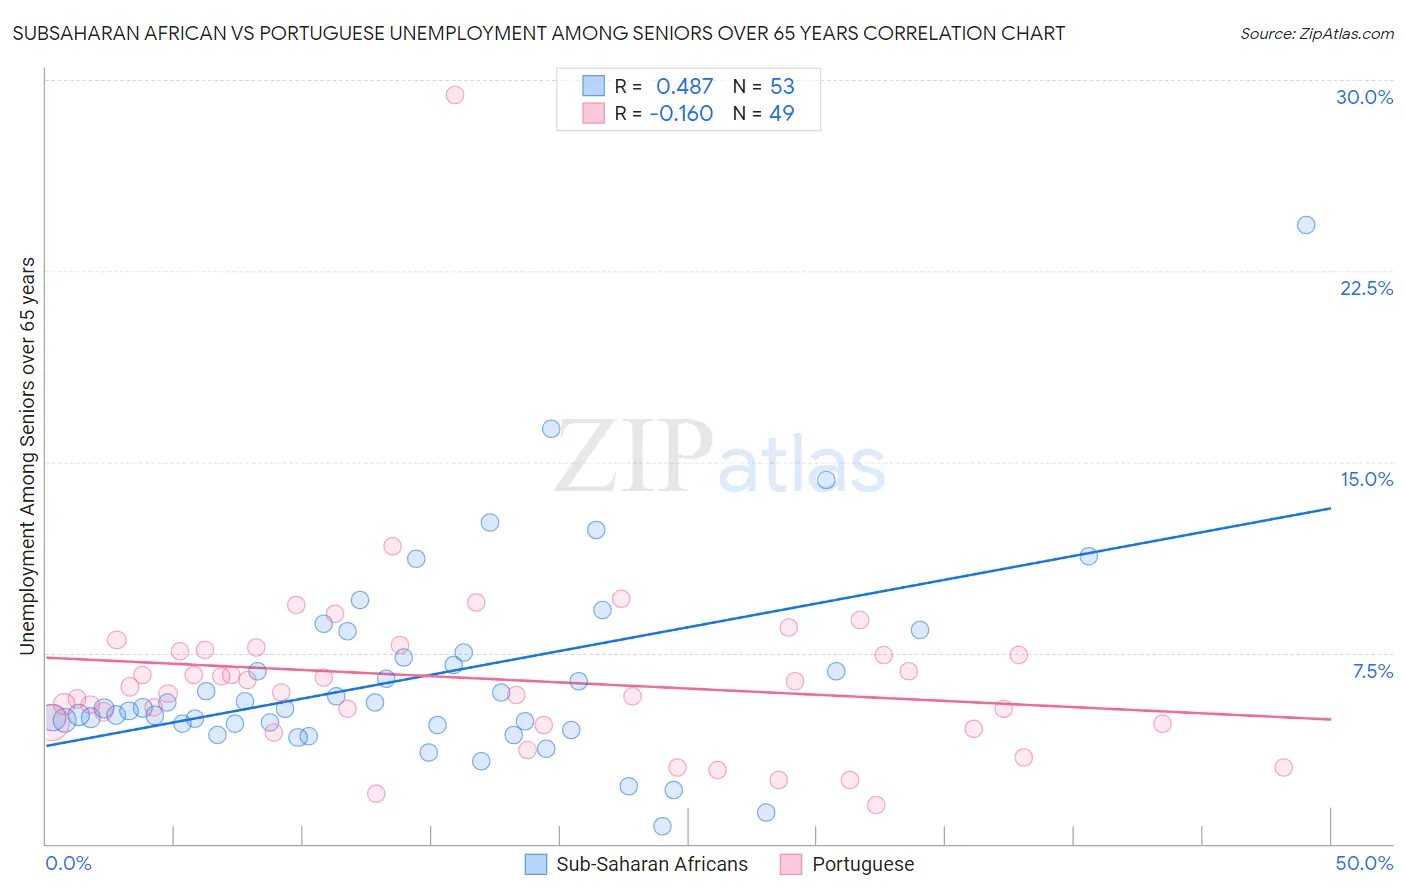
Subsaharan African vs Portuguese Unemployment Among Seniors over 65 years Correlation Chart
The statistical analysis conducted on geographies consisting of 436,089,734 people shows a moderate positive correlation between the proportion of Sub-Saharan Africans and unemployment rate amomg seniors over the age of 65 in the United States with a correlation coefficient (R) of 0.487 and weighted average of 5.2%. Similarly, the statistical analysis conducted on geographies consisting of 396,569,637 people shows a poor negative correlation between the proportion of Portuguese and unemployment rate amomg seniors over the age of 65 in the United States with a correlation coefficient (R) of -0.160 and weighted average of 5.6%, a difference of 7.5%.
Unemployment Among Seniors over 65 years Correlation Summary
| Measurement | Subsaharan African | Portuguese |
| Minimum | 0.70% | 1.5% |
| Maximum | 24.3% | 29.4% |
| Range | 23.6% | 27.9% |
| Mean | 6.5% | 6.5% |
| Median | 5.3% | 5.9% |
| Interquartile 25% (IQ1) | 4.7% | 4.7% |
| Interquartile 75% (IQ3) | 7.4% | 7.6% |
| Interquartile Range (IQR) | 2.7% | 2.9% |
| Standard Deviation (Sample) | 4.0% | 4.0% |
| Standard Deviation (Population) | 3.9% | 3.9% |
Similar Demographics by Unemployment Among Seniors over 65 years
Demographics Similar to Sub-Saharan Africans by Unemployment Among Seniors over 65 years
In terms of unemployment among seniors over 65 years, the demographic groups most similar to Sub-Saharan Africans are Immigrants from China (5.2%, a difference of 0.010%), Immigrants from Northern Africa (5.2%, a difference of 0.030%), Laotian (5.2%, a difference of 0.060%), Immigrants from Pakistan (5.2%, a difference of 0.070%), and Immigrants from Europe (5.2%, a difference of 0.10%).
| Demographics | Rating | Rank | Unemployment Among Seniors over 65 years |
| Immigrants | Poland | 24.3 /100 | #196 | Fair 5.2% |
| Guamanians/Chamorros | 22.5 /100 | #197 | Fair 5.2% |
| Maltese | 19.6 /100 | #198 | Poor 5.2% |
| Immigrants | Europe | 19.0 /100 | #199 | Poor 5.2% |
| Immigrants | Pakistan | 18.4 /100 | #200 | Poor 5.2% |
| Laotians | 18.1 /100 | #201 | Poor 5.2% |
| Immigrants | Northern Africa | 17.7 /100 | #202 | Poor 5.2% |
| Sub-Saharan Africans | 17.1 /100 | #203 | Poor 5.2% |
| Immigrants | China | 16.9 /100 | #204 | Poor 5.2% |
| South American Indians | 15.3 /100 | #205 | Poor 5.2% |
| German Russians | 14.7 /100 | #206 | Poor 5.2% |
| Immigrants | Philippines | 13.2 /100 | #207 | Poor 5.2% |
| Uruguayans | 12.6 /100 | #208 | Poor 5.2% |
| Alsatians | 11.4 /100 | #209 | Poor 5.2% |
| Immigrants | Uzbekistan | 10.7 /100 | #210 | Poor 5.2% |
Demographics Similar to Portuguese by Unemployment Among Seniors over 65 years
In terms of unemployment among seniors over 65 years, the demographic groups most similar to Portuguese are Ecuadorian (5.6%, a difference of 0.050%), Mexican (5.6%, a difference of 0.090%), Immigrants from St. Vincent and the Grenadines (5.6%, a difference of 0.090%), Liberian (5.6%, a difference of 0.25%), and Immigrants from Guatemala (5.6%, a difference of 0.30%).
| Demographics | Rating | Rank | Unemployment Among Seniors over 65 years |
| Zimbabweans | 0.0 /100 | #300 | Tragic 5.6% |
| Hispanics or Latinos | 0.0 /100 | #301 | Tragic 5.6% |
| Guatemalans | 0.0 /100 | #302 | Tragic 5.6% |
| Immigrants | Latin America | 0.0 /100 | #303 | Tragic 5.6% |
| Liberians | 0.0 /100 | #304 | Tragic 5.6% |
| Mexicans | 0.0 /100 | #305 | Tragic 5.6% |
| Ecuadorians | 0.0 /100 | #306 | Tragic 5.6% |
| Portuguese | 0.0 /100 | #307 | Tragic 5.6% |
| Immigrants | St. Vincent and the Grenadines | 0.0 /100 | #308 | Tragic 5.6% |
| Immigrants | Guatemala | 0.0 /100 | #309 | Tragic 5.6% |
| Salvadorans | 0.0 /100 | #310 | Tragic 5.6% |
| Immigrants | Guyana | 0.0 /100 | #311 | Tragic 5.6% |
| Immigrants | Ecuador | 0.0 /100 | #312 | Tragic 5.6% |
| Barbadians | 0.0 /100 | #313 | Tragic 5.6% |
| Delaware | 0.0 /100 | #314 | Tragic 5.7% |