Subsaharan African vs Taiwanese Unemployment Among Seniors over 65 years
COMPARE
Subsaharan African
Taiwanese
Unemployment Among Seniors over 65 years
Unemployment Among Seniors over 65 years Comparison
Sub-Saharan Africans
Taiwanese
5.2%
UNEMPLOYMENT AMONG SENIORS OVER 65 YEARS
17.1/ 100
METRIC RATING
203rd/ 347
METRIC RANK
6.0%
UNEMPLOYMENT AMONG SENIORS OVER 65 YEARS
0.0/ 100
METRIC RATING
331st/ 347
METRIC RANK
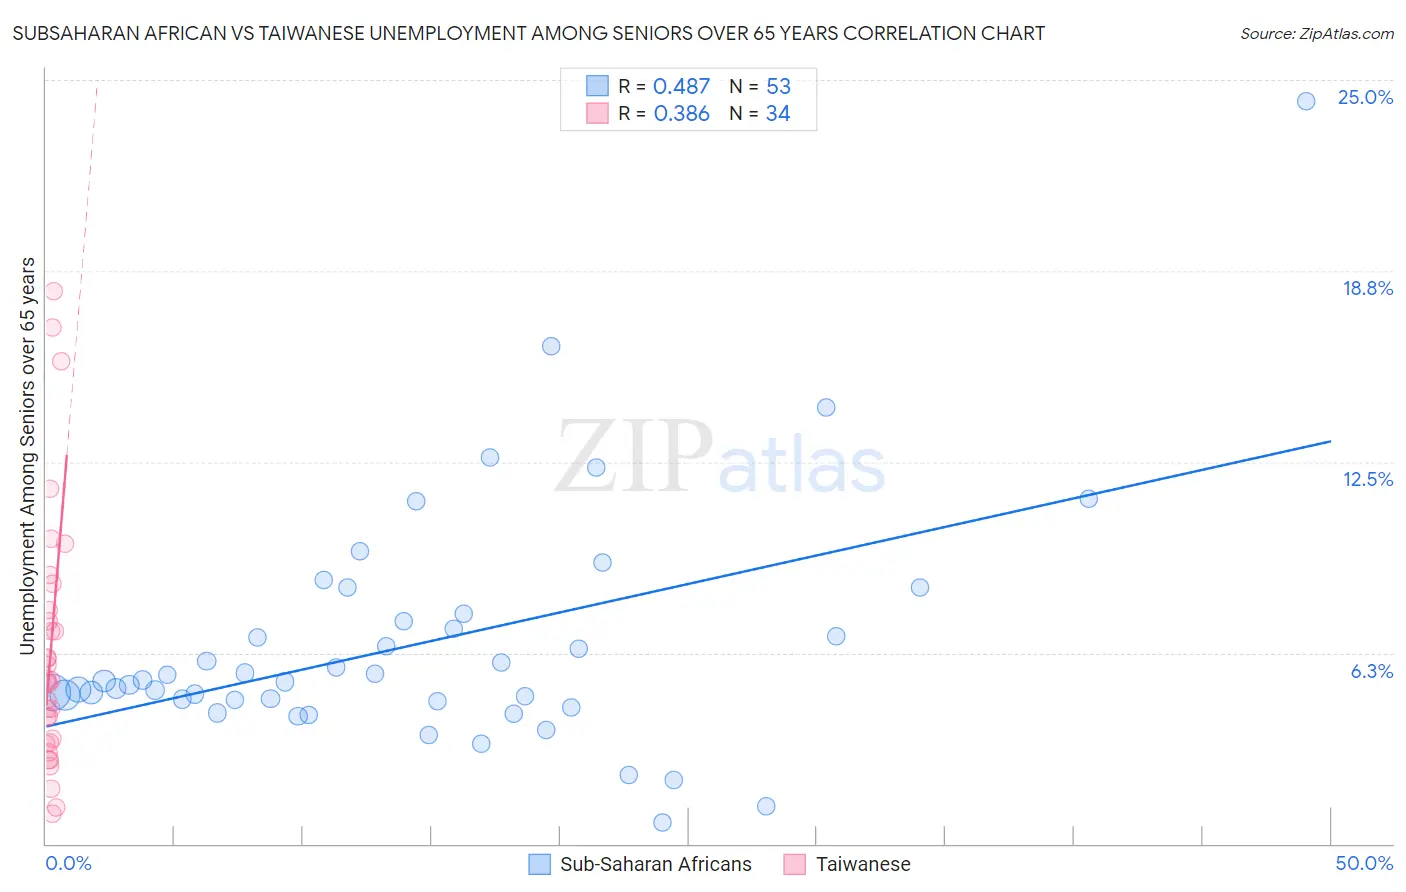
Subsaharan African vs Taiwanese Unemployment Among Seniors over 65 years Correlation Chart
The statistical analysis conducted on geographies consisting of 436,089,734 people shows a moderate positive correlation between the proportion of Sub-Saharan Africans and unemployment rate amomg seniors over the age of 65 in the United States with a correlation coefficient (R) of 0.487 and weighted average of 5.2%. Similarly, the statistical analysis conducted on geographies consisting of 31,497,797 people shows a mild positive correlation between the proportion of Taiwanese and unemployment rate amomg seniors over the age of 65 in the United States with a correlation coefficient (R) of 0.386 and weighted average of 6.0%, a difference of 14.6%.
Unemployment Among Seniors over 65 years Correlation Summary
| Measurement | Subsaharan African | Taiwanese |
| Minimum | 0.70% | 1.0% |
| Maximum | 24.3% | 18.1% |
| Range | 23.6% | 17.1% |
| Mean | 6.5% | 6.3% |
| Median | 5.3% | 5.3% |
| Interquartile 25% (IQ1) | 4.7% | 3.3% |
| Interquartile 75% (IQ3) | 7.4% | 7.6% |
| Interquartile Range (IQR) | 2.7% | 4.3% |
| Standard Deviation (Sample) | 4.0% | 4.2% |
| Standard Deviation (Population) | 3.9% | 4.1% |
Similar Demographics by Unemployment Among Seniors over 65 years
Demographics Similar to Sub-Saharan Africans by Unemployment Among Seniors over 65 years
In terms of unemployment among seniors over 65 years, the demographic groups most similar to Sub-Saharan Africans are Immigrants from China (5.2%, a difference of 0.010%), Immigrants from Northern Africa (5.2%, a difference of 0.030%), Laotian (5.2%, a difference of 0.060%), Immigrants from Pakistan (5.2%, a difference of 0.070%), and Immigrants from Europe (5.2%, a difference of 0.10%).
| Demographics | Rating | Rank | Unemployment Among Seniors over 65 years |
| Immigrants | Poland | 24.3 /100 | #196 | Fair 5.2% |
| Guamanians/Chamorros | 22.5 /100 | #197 | Fair 5.2% |
| Maltese | 19.6 /100 | #198 | Poor 5.2% |
| Immigrants | Europe | 19.0 /100 | #199 | Poor 5.2% |
| Immigrants | Pakistan | 18.4 /100 | #200 | Poor 5.2% |
| Laotians | 18.1 /100 | #201 | Poor 5.2% |
| Immigrants | Northern Africa | 17.7 /100 | #202 | Poor 5.2% |
| Sub-Saharan Africans | 17.1 /100 | #203 | Poor 5.2% |
| Immigrants | China | 16.9 /100 | #204 | Poor 5.2% |
| South American Indians | 15.3 /100 | #205 | Poor 5.2% |
| German Russians | 14.7 /100 | #206 | Poor 5.2% |
| Immigrants | Philippines | 13.2 /100 | #207 | Poor 5.2% |
| Uruguayans | 12.6 /100 | #208 | Poor 5.2% |
| Alsatians | 11.4 /100 | #209 | Poor 5.2% |
| Immigrants | Uzbekistan | 10.7 /100 | #210 | Poor 5.2% |
Demographics Similar to Taiwanese by Unemployment Among Seniors over 65 years
In terms of unemployment among seniors over 65 years, the demographic groups most similar to Taiwanese are Aleut (6.0%, a difference of 0.050%), Immigrants from Portugal (6.0%, a difference of 0.15%), Dominican (6.0%, a difference of 0.17%), Immigrants from Dominican Republic (6.0%, a difference of 0.60%), and Puerto Rican (5.9%, a difference of 0.92%).
| Demographics | Rating | Rank | Unemployment Among Seniors over 65 years |
| Yuman | 0.0 /100 | #324 | Tragic 5.8% |
| Inupiat | 0.0 /100 | #325 | Tragic 5.8% |
| Shoshone | 0.0 /100 | #326 | Tragic 5.9% |
| Bermudans | 0.0 /100 | #327 | Tragic 5.9% |
| Puerto Ricans | 0.0 /100 | #328 | Tragic 5.9% |
| Dominicans | 0.0 /100 | #329 | Tragic 6.0% |
| Immigrants | Portugal | 0.0 /100 | #330 | Tragic 6.0% |
| Taiwanese | 0.0 /100 | #331 | Tragic 6.0% |
| Aleuts | 0.0 /100 | #332 | Tragic 6.0% |
| Immigrants | Dominican Republic | 0.0 /100 | #333 | Tragic 6.0% |
| Tohono O'odham | 0.0 /100 | #334 | Tragic 6.1% |
| Immigrants | Armenia | 0.0 /100 | #335 | Tragic 6.2% |
| Pima | 0.0 /100 | #336 | Tragic 6.3% |
| Alaska Natives | 0.0 /100 | #337 | Tragic 6.3% |
| Immigrants | Azores | 0.0 /100 | #338 | Tragic 6.3% |