Immigrants from Cabo Verde vs Assyrian/Chaldean/Syriac Unemployment Among Ages 20 to 24 years
COMPARE
Immigrants from Cabo Verde
Assyrian/Chaldean/Syriac
Unemployment Among Ages 20 to 24 years
Unemployment Among Ages 20 to 24 years Comparison
Immigrants from Cabo Verde
Assyrians/Chaldeans/Syriacs
12.2%
UNEMPLOYMENT AMONG AGES 20 TO 24 YEARS
0.0/ 100
METRIC RATING
302nd/ 347
METRIC RANK
9.9%
UNEMPLOYMENT AMONG AGES 20 TO 24 YEARS
98.3/ 100
METRIC RATING
78th/ 347
METRIC RANK
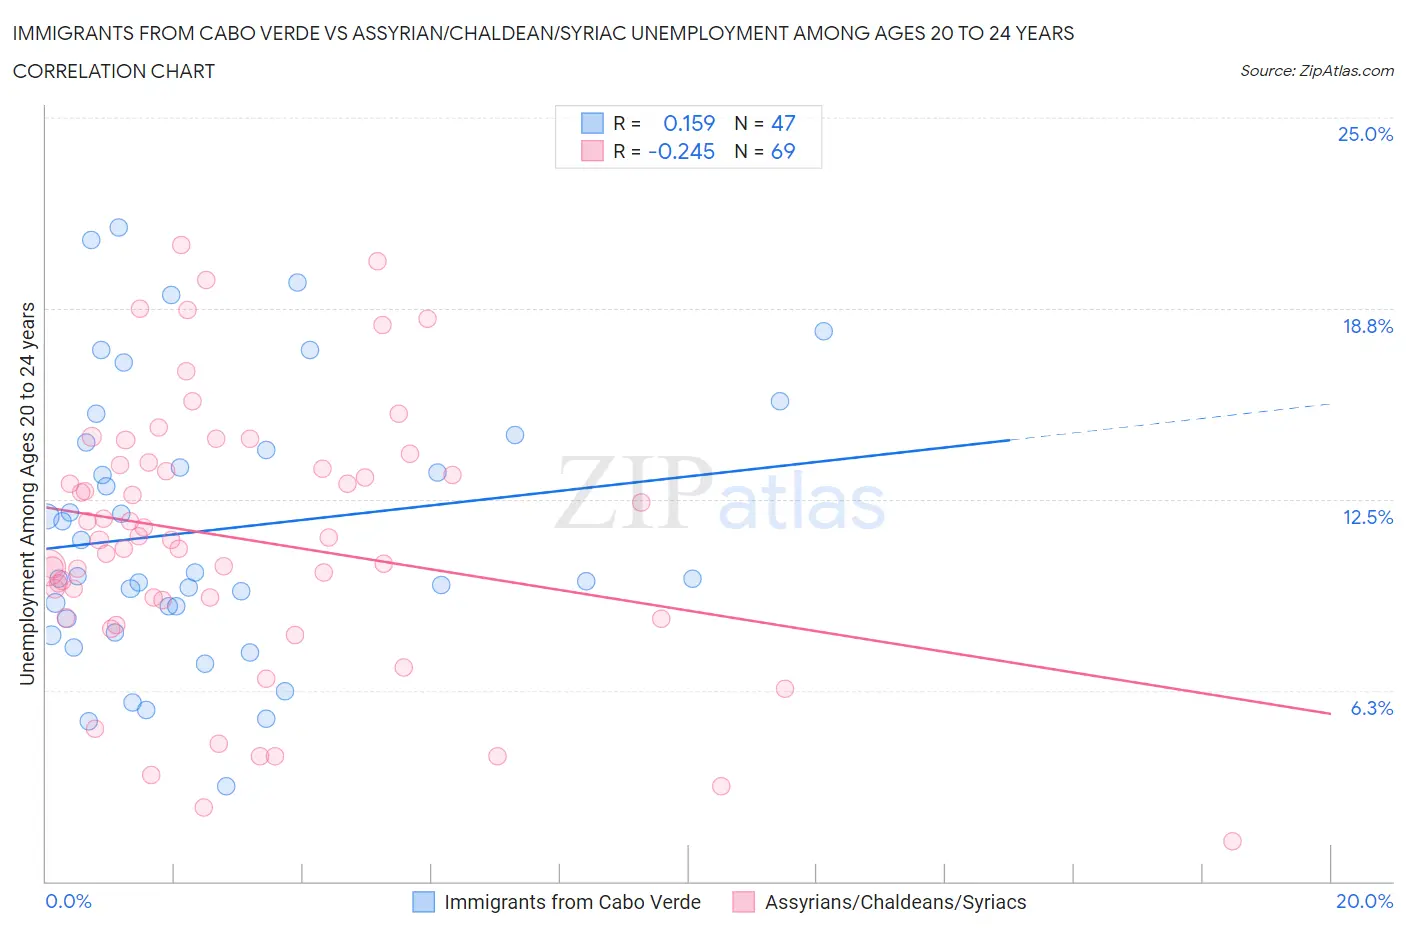
Immigrants from Cabo Verde vs Assyrian/Chaldean/Syriac Unemployment Among Ages 20 to 24 years Correlation Chart
The statistical analysis conducted on geographies consisting of 37,888,752 people shows a poor positive correlation between the proportion of Immigrants from Cabo Verde and unemployment rate among population between the ages 20 and 24 in the United States with a correlation coefficient (R) of 0.159 and weighted average of 12.2%. Similarly, the statistical analysis conducted on geographies consisting of 109,491,073 people shows a weak negative correlation between the proportion of Assyrians/Chaldeans/Syriacs and unemployment rate among population between the ages 20 and 24 in the United States with a correlation coefficient (R) of -0.245 and weighted average of 9.9%, a difference of 23.2%.
Unemployment Among Ages 20 to 24 years Correlation Summary
| Measurement | Immigrants from Cabo Verde | Assyrian/Chaldean/Syriac |
| Minimum | 3.1% | 1.3% |
| Maximum | 21.4% | 20.8% |
| Range | 18.3% | 19.5% |
| Mean | 11.5% | 11.2% |
| Median | 10.0% | 11.2% |
| Interquartile 25% (IQ1) | 8.6% | 8.9% |
| Interquartile 75% (IQ3) | 14.4% | 13.7% |
| Interquartile Range (IQR) | 5.8% | 4.8% |
| Standard Deviation (Sample) | 4.4% | 4.4% |
| Standard Deviation (Population) | 4.4% | 4.3% |
Similar Demographics by Unemployment Among Ages 20 to 24 years
Demographics Similar to Immigrants from Cabo Verde by Unemployment Among Ages 20 to 24 years
In terms of unemployment among ages 20 to 24 years, the demographic groups most similar to Immigrants from Cabo Verde are Haitian (12.2%, a difference of 0.020%), Immigrants from West Indies (12.3%, a difference of 0.61%), Chippewa (12.3%, a difference of 0.65%), Immigrants from Sierra Leone (12.1%, a difference of 0.85%), and Spanish American Indian (12.1%, a difference of 1.3%).
| Demographics | Rating | Rank | Unemployment Among Ages 20 to 24 years |
| Immigrants | Armenia | 0.0 /100 | #295 | Tragic 12.0% |
| Cajuns | 0.0 /100 | #296 | Tragic 12.0% |
| Blackfeet | 0.0 /100 | #297 | Tragic 12.0% |
| Lumbee | 0.0 /100 | #298 | Tragic 12.0% |
| Apache | 0.0 /100 | #299 | Tragic 12.0% |
| Spanish American Indians | 0.0 /100 | #300 | Tragic 12.1% |
| Immigrants | Sierra Leone | 0.0 /100 | #301 | Tragic 12.1% |
| Immigrants | Cabo Verde | 0.0 /100 | #302 | Tragic 12.2% |
| Haitians | 0.0 /100 | #303 | Tragic 12.2% |
| Immigrants | West Indies | 0.0 /100 | #304 | Tragic 12.3% |
| Chippewa | 0.0 /100 | #305 | Tragic 12.3% |
| Immigrants | Haiti | 0.0 /100 | #306 | Tragic 12.4% |
| Bermudans | 0.0 /100 | #307 | Tragic 12.5% |
| Tohono O'odham | 0.0 /100 | #308 | Tragic 12.5% |
| Immigrants | Bangladesh | 0.0 /100 | #309 | Tragic 12.6% |
Demographics Similar to Assyrians/Chaldeans/Syriacs by Unemployment Among Ages 20 to 24 years
In terms of unemployment among ages 20 to 24 years, the demographic groups most similar to Assyrians/Chaldeans/Syriacs are Icelander (9.9%, a difference of 0.020%), Chickasaw (9.9%, a difference of 0.030%), Czechoslovakian (9.9%, a difference of 0.050%), Immigrants from Netherlands (9.9%, a difference of 0.070%), and Immigrants from Australia (9.9%, a difference of 0.14%).
| Demographics | Rating | Rank | Unemployment Among Ages 20 to 24 years |
| Celtics | 98.9 /100 | #71 | Exceptional 9.9% |
| Bolivians | 98.9 /100 | #72 | Exceptional 9.9% |
| Kenyans | 98.7 /100 | #73 | Exceptional 9.9% |
| Immigrants | Laos | 98.7 /100 | #74 | Exceptional 9.9% |
| Immigrants | Australia | 98.6 /100 | #75 | Exceptional 9.9% |
| Czechoslovakians | 98.4 /100 | #76 | Exceptional 9.9% |
| Chickasaw | 98.4 /100 | #77 | Exceptional 9.9% |
| Assyrians/Chaldeans/Syriacs | 98.3 /100 | #78 | Exceptional 9.9% |
| Icelanders | 98.3 /100 | #79 | Exceptional 9.9% |
| Immigrants | Netherlands | 98.2 /100 | #80 | Exceptional 9.9% |
| Yaqui | 98.0 /100 | #81 | Exceptional 9.9% |
| Sri Lankans | 98.0 /100 | #82 | Exceptional 9.9% |
| Immigrants | Bulgaria | 98.0 /100 | #83 | Exceptional 9.9% |
| Latvians | 97.9 /100 | #84 | Exceptional 9.9% |
| New Zealanders | 97.8 /100 | #85 | Exceptional 9.9% |