Sri Lankan vs Immigrants from Poland Unemployment Among Ages 20 to 24 years
COMPARE
Sri Lankan
Immigrants from Poland
Unemployment Among Ages 20 to 24 years
Unemployment Among Ages 20 to 24 years Comparison
Sri Lankans
Immigrants from Poland
9.9%
UNEMPLOYMENT AMONG AGES 20 TO 24 YEARS
98.0/ 100
METRIC RATING
82nd/ 347
METRIC RANK
10.6%
UNEMPLOYMENT AMONG AGES 20 TO 24 YEARS
6.4/ 100
METRIC RATING
222nd/ 347
METRIC RANK
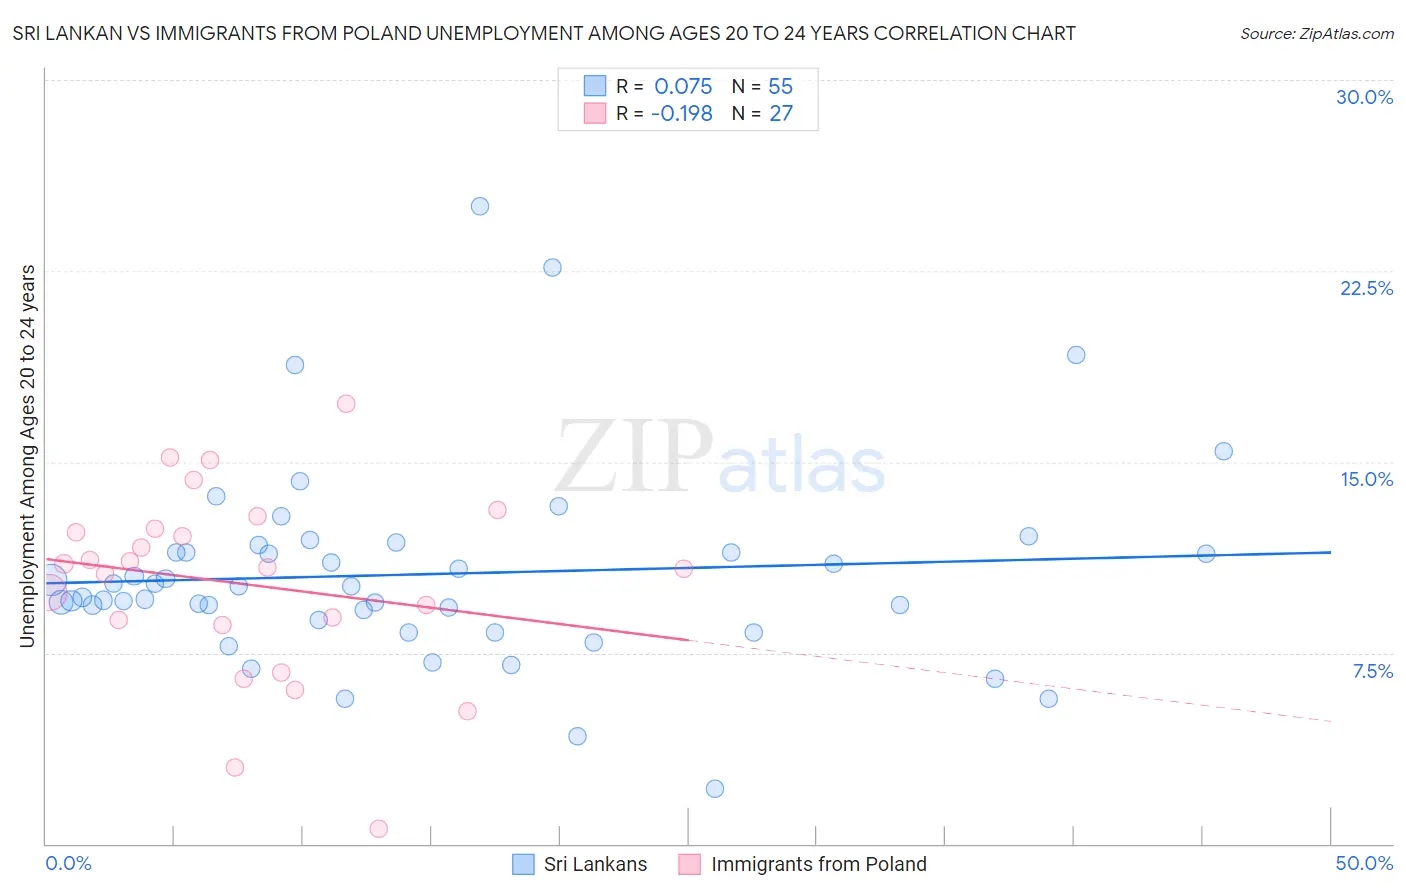
Sri Lankan vs Immigrants from Poland Unemployment Among Ages 20 to 24 years Correlation Chart
The statistical analysis conducted on geographies consisting of 426,757,602 people shows a slight positive correlation between the proportion of Sri Lankans and unemployment rate among population between the ages 20 and 24 in the United States with a correlation coefficient (R) of 0.075 and weighted average of 9.9%. Similarly, the statistical analysis conducted on geographies consisting of 297,639,677 people shows a poor negative correlation between the proportion of Immigrants from Poland and unemployment rate among population between the ages 20 and 24 in the United States with a correlation coefficient (R) of -0.198 and weighted average of 10.6%, a difference of 6.2%.
Unemployment Among Ages 20 to 24 years Correlation Summary
| Measurement | Sri Lankan | Immigrants from Poland |
| Minimum | 2.2% | 0.60% |
| Maximum | 25.0% | 17.3% |
| Range | 22.9% | 16.7% |
| Mean | 10.6% | 10.2% |
| Median | 10.1% | 10.8% |
| Interquartile 25% (IQ1) | 8.8% | 8.6% |
| Interquartile 75% (IQ3) | 11.4% | 12.4% |
| Interquartile Range (IQR) | 2.7% | 3.8% |
| Standard Deviation (Sample) | 3.9% | 3.8% |
| Standard Deviation (Population) | 3.9% | 3.7% |
Similar Demographics by Unemployment Among Ages 20 to 24 years
Demographics Similar to Sri Lankans by Unemployment Among Ages 20 to 24 years
In terms of unemployment among ages 20 to 24 years, the demographic groups most similar to Sri Lankans are Yaqui (9.9%, a difference of 0.0%), Immigrants from Bulgaria (9.9%, a difference of 0.020%), Latvian (9.9%, a difference of 0.030%), New Zealander (9.9%, a difference of 0.070%), and Immigrants from Netherlands (9.9%, a difference of 0.12%).
| Demographics | Rating | Rank | Unemployment Among Ages 20 to 24 years |
| Immigrants | Australia | 98.6 /100 | #75 | Exceptional 9.9% |
| Czechoslovakians | 98.4 /100 | #76 | Exceptional 9.9% |
| Chickasaw | 98.4 /100 | #77 | Exceptional 9.9% |
| Assyrians/Chaldeans/Syriacs | 98.3 /100 | #78 | Exceptional 9.9% |
| Icelanders | 98.3 /100 | #79 | Exceptional 9.9% |
| Immigrants | Netherlands | 98.2 /100 | #80 | Exceptional 9.9% |
| Yaqui | 98.0 /100 | #81 | Exceptional 9.9% |
| Sri Lankans | 98.0 /100 | #82 | Exceptional 9.9% |
| Immigrants | Bulgaria | 98.0 /100 | #83 | Exceptional 9.9% |
| Latvians | 97.9 /100 | #84 | Exceptional 9.9% |
| New Zealanders | 97.8 /100 | #85 | Exceptional 9.9% |
| Immigrants | Vietnam | 97.5 /100 | #86 | Exceptional 10.0% |
| Immigrants | Oceania | 97.4 /100 | #87 | Exceptional 10.0% |
| Poles | 97.1 /100 | #88 | Exceptional 10.0% |
| Macedonians | 97.0 /100 | #89 | Exceptional 10.0% |
Demographics Similar to Immigrants from Poland by Unemployment Among Ages 20 to 24 years
In terms of unemployment among ages 20 to 24 years, the demographic groups most similar to Immigrants from Poland are Central American (10.6%, a difference of 0.060%), Eastern European (10.6%, a difference of 0.070%), Arab (10.6%, a difference of 0.12%), Immigrants from Southern Europe (10.5%, a difference of 0.21%), and Nepalese (10.6%, a difference of 0.21%).
| Demographics | Rating | Rank | Unemployment Among Ages 20 to 24 years |
| Hondurans | 10.5 /100 | #215 | Poor 10.5% |
| Costa Ricans | 9.6 /100 | #216 | Tragic 10.5% |
| Cherokee | 9.3 /100 | #217 | Tragic 10.5% |
| Immigrants | Nonimmigrants | 8.8 /100 | #218 | Tragic 10.5% |
| Immigrants | Southern Europe | 8.0 /100 | #219 | Tragic 10.5% |
| Eastern Europeans | 6.9 /100 | #220 | Tragic 10.6% |
| Central Americans | 6.8 /100 | #221 | Tragic 10.6% |
| Immigrants | Poland | 6.4 /100 | #222 | Tragic 10.6% |
| Arabs | 5.6 /100 | #223 | Tragic 10.6% |
| Nepalese | 5.1 /100 | #224 | Tragic 10.6% |
| Immigrants | South America | 5.1 /100 | #225 | Tragic 10.6% |
| Immigrants | Costa Rica | 4.9 /100 | #226 | Tragic 10.6% |
| Palestinians | 4.9 /100 | #227 | Tragic 10.6% |
| Mexican American Indians | 4.6 /100 | #228 | Tragic 10.6% |
| Americans | 4.4 /100 | #229 | Tragic 10.6% |