Immigrants from North America vs Macedonian Unemployment Among Women with Children Ages 6 to 17 years
COMPARE
Immigrants from North America
Macedonian
Unemployment Among Women with Children Ages 6 to 17 years
Unemployment Among Women with Children Ages 6 to 17 years Comparison
Immigrants from North America
Macedonians
9.2%
UNEMPLOYMENT AMONG WOMEN WITH CHILDREN AGES 6 TO 17 YEARS
12.7/ 100
METRIC RATING
206th/ 347
METRIC RANK
9.3%
UNEMPLOYMENT AMONG WOMEN WITH CHILDREN AGES 6 TO 17 YEARS
3.9/ 100
METRIC RATING
231st/ 347
METRIC RANK
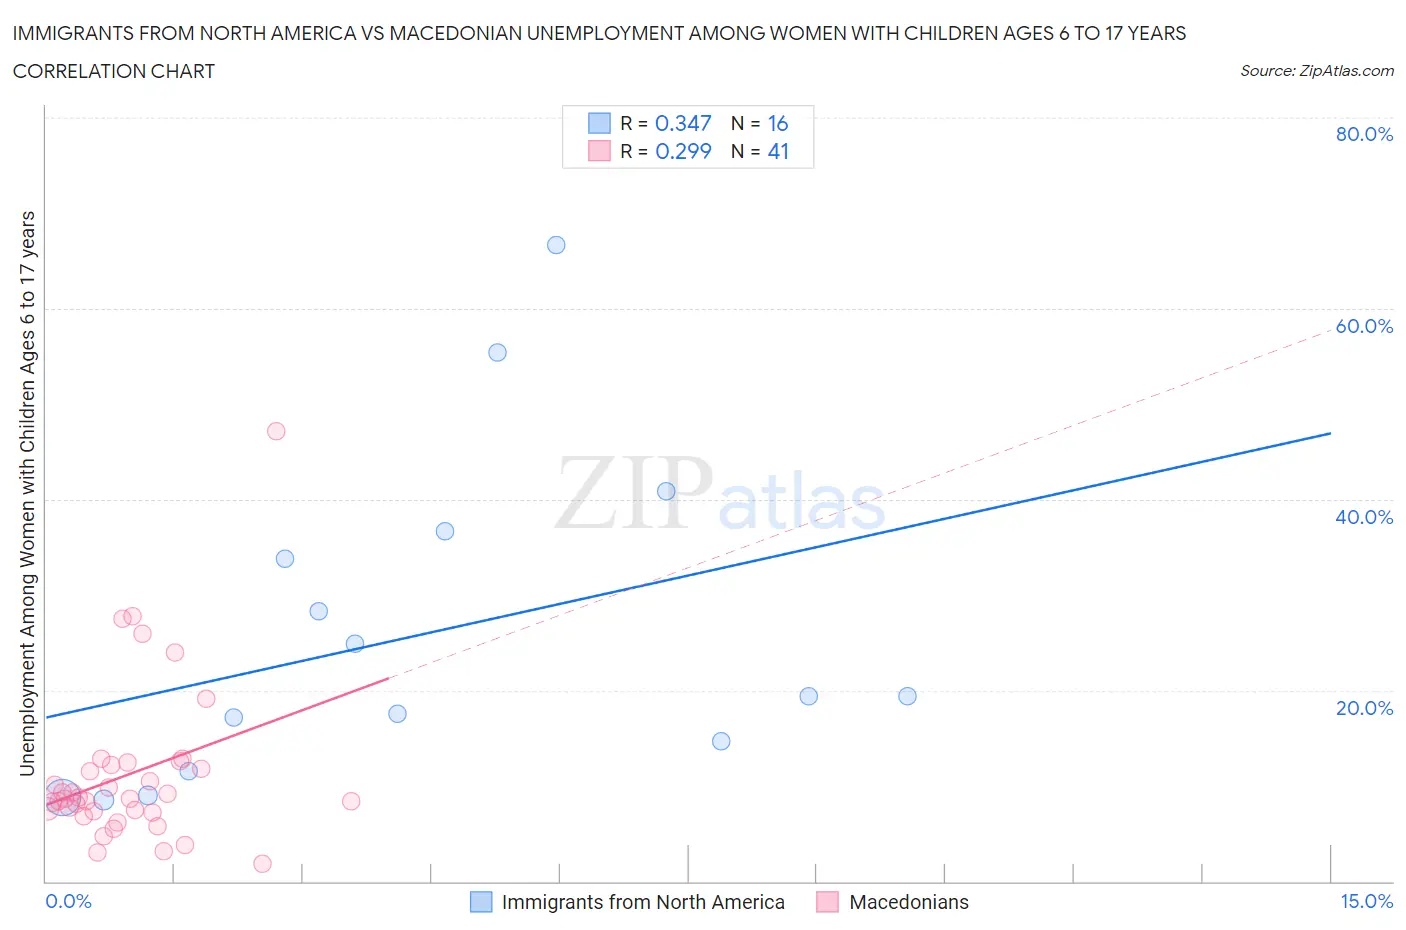
Immigrants from North America vs Macedonian Unemployment Among Women with Children Ages 6 to 17 years Correlation Chart
The statistical analysis conducted on geographies consisting of 313,856,079 people shows a mild positive correlation between the proportion of Immigrants from North America and unemployment rate among women with children between the ages 6 and 17 in the United States with a correlation coefficient (R) of 0.347 and weighted average of 9.2%. Similarly, the statistical analysis conducted on geographies consisting of 106,790,801 people shows a weak positive correlation between the proportion of Macedonians and unemployment rate among women with children between the ages 6 and 17 in the United States with a correlation coefficient (R) of 0.299 and weighted average of 9.3%, a difference of 1.4%.
Unemployment Among Women with Children Ages 6 to 17 years Correlation Summary
| Measurement | Immigrants from North America | Macedonian |
| Minimum | 8.5% | 1.8% |
| Maximum | 66.7% | 47.1% |
| Range | 58.2% | 45.3% |
| Mean | 25.8% | 11.3% |
| Median | 19.4% | 8.7% |
| Interquartile 25% (IQ1) | 13.1% | 7.3% |
| Interquartile 75% (IQ3) | 35.2% | 12.3% |
| Interquartile Range (IQR) | 22.2% | 5.1% |
| Standard Deviation (Sample) | 17.1% | 8.4% |
| Standard Deviation (Population) | 16.6% | 8.3% |
Similar Demographics by Unemployment Among Women with Children Ages 6 to 17 years
Demographics Similar to Immigrants from North America by Unemployment Among Women with Children Ages 6 to 17 years
In terms of unemployment among women with children ages 6 to 17 years, the demographic groups most similar to Immigrants from North America are Immigrants from Western Europe (9.1%, a difference of 0.13%), Cuban (9.2%, a difference of 0.20%), Immigrants from Peru (9.2%, a difference of 0.20%), Salvadoran (9.2%, a difference of 0.21%), and Immigrants from Canada (9.1%, a difference of 0.23%).
| Demographics | Rating | Rank | Unemployment Among Women with Children Ages 6 to 17 years |
| Czechoslovakians | 20.8 /100 | #199 | Fair 9.1% |
| Trinidadians and Tobagonians | 18.2 /100 | #200 | Poor 9.1% |
| Immigrants | Trinidad and Tobago | 16.7 /100 | #201 | Poor 9.1% |
| Immigrants | Middle Africa | 15.6 /100 | #202 | Poor 9.1% |
| Maltese | 15.3 /100 | #203 | Poor 9.1% |
| Immigrants | Canada | 15.3 /100 | #204 | Poor 9.1% |
| Immigrants | Western Europe | 14.1 /100 | #205 | Poor 9.1% |
| Immigrants | North America | 12.7 /100 | #206 | Poor 9.2% |
| Cubans | 10.9 /100 | #207 | Poor 9.2% |
| Immigrants | Peru | 10.8 /100 | #208 | Poor 9.2% |
| Salvadorans | 10.7 /100 | #209 | Poor 9.2% |
| Finns | 10.0 /100 | #210 | Tragic 9.2% |
| Immigrants | Cuba | 9.6 /100 | #211 | Tragic 9.2% |
| Peruvians | 9.0 /100 | #212 | Tragic 9.2% |
| Spaniards | 8.2 /100 | #213 | Tragic 9.2% |
Demographics Similar to Macedonians by Unemployment Among Women with Children Ages 6 to 17 years
In terms of unemployment among women with children ages 6 to 17 years, the demographic groups most similar to Macedonians are Welsh (9.3%, a difference of 0.010%), French American Indian (9.3%, a difference of 0.060%), Lumbee (9.3%, a difference of 0.10%), Estonian (9.3%, a difference of 0.14%), and Panamanian (9.3%, a difference of 0.16%).
| Demographics | Rating | Rank | Unemployment Among Women with Children Ages 6 to 17 years |
| Immigrants | El Salvador | 5.3 /100 | #224 | Tragic 9.3% |
| Chinese | 5.2 /100 | #225 | Tragic 9.3% |
| Immigrants | Azores | 4.6 /100 | #226 | Tragic 9.3% |
| Panamanians | 4.5 /100 | #227 | Tragic 9.3% |
| Estonians | 4.4 /100 | #228 | Tragic 9.3% |
| Lumbee | 4.3 /100 | #229 | Tragic 9.3% |
| Welsh | 4.0 /100 | #230 | Tragic 9.3% |
| Macedonians | 3.9 /100 | #231 | Tragic 9.3% |
| French American Indians | 3.7 /100 | #232 | Tragic 9.3% |
| Immigrants | St. Vincent and the Grenadines | 3.3 /100 | #233 | Tragic 9.3% |
| Mexicans | 3.2 /100 | #234 | Tragic 9.3% |
| Uruguayans | 3.0 /100 | #235 | Tragic 9.3% |
| Hungarians | 3.0 /100 | #236 | Tragic 9.3% |
| Immigrants | Belize | 2.8 /100 | #237 | Tragic 9.3% |
| Arabs | 2.7 /100 | #238 | Tragic 9.3% |