Sri Lankan vs Okinawan Female Unemployment
COMPARE
Sri Lankan
Okinawan
Female Unemployment
Female Unemployment Comparison
Sri Lankans
Okinawans
5.2%
FEMALE UNEMPLOYMENT
59.4/ 100
METRIC RATING
168th/ 347
METRIC RANK
4.9%
FEMALE UNEMPLOYMENT
99.3/ 100
METRIC RATING
47th/ 347
METRIC RANK
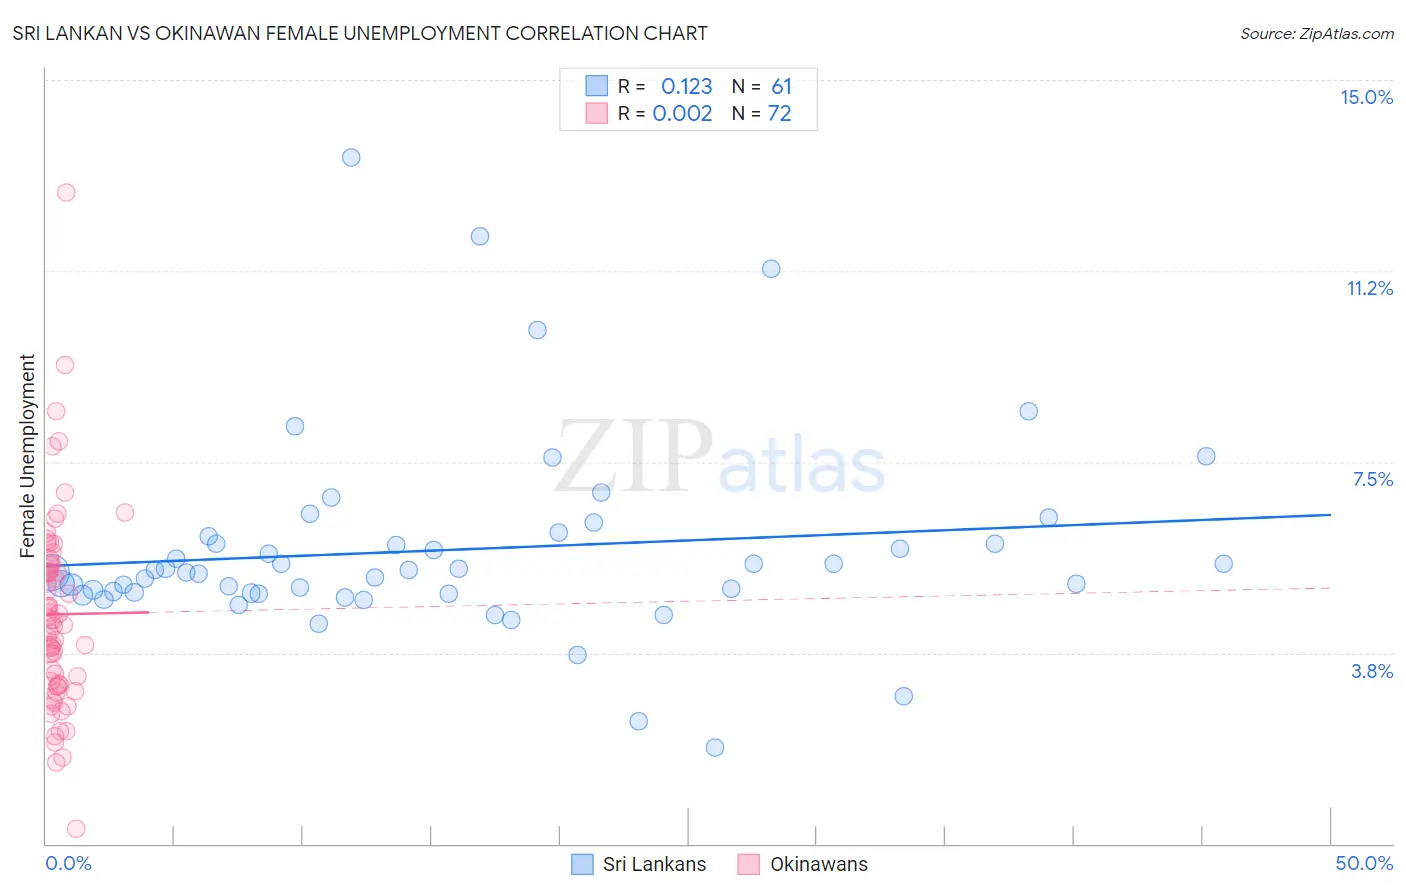
Sri Lankan vs Okinawan Female Unemployment Correlation Chart
The statistical analysis conducted on geographies consisting of 438,500,315 people shows a poor positive correlation between the proportion of Sri Lankans and unemploymnet rate among females in the United States with a correlation coefficient (R) of 0.123 and weighted average of 5.2%. Similarly, the statistical analysis conducted on geographies consisting of 73,722,154 people shows no correlation between the proportion of Okinawans and unemploymnet rate among females in the United States with a correlation coefficient (R) of 0.002 and weighted average of 4.9%, a difference of 7.4%.
Female Unemployment Correlation Summary
| Measurement | Sri Lankan | Okinawan |
| Minimum | 1.9% | 0.30% |
| Maximum | 13.5% | 12.8% |
| Range | 11.6% | 12.5% |
| Mean | 5.8% | 4.5% |
| Median | 5.3% | 4.3% |
| Interquartile 25% (IQ1) | 4.9% | 3.1% |
| Interquartile 75% (IQ3) | 6.0% | 5.4% |
| Interquartile Range (IQR) | 1.1% | 2.3% |
| Standard Deviation (Sample) | 2.0% | 1.9% |
| Standard Deviation (Population) | 1.9% | 1.9% |
Similar Demographics by Female Unemployment
Demographics Similar to Sri Lankans by Female Unemployment
In terms of female unemployment, the demographic groups most similar to Sri Lankans are Immigrants from Chile (5.2%, a difference of 0.030%), Immigrants from Thailand (5.2%, a difference of 0.17%), Syrian (5.2%, a difference of 0.21%), Native Hawaiian (5.2%, a difference of 0.21%), and Spanish (5.2%, a difference of 0.22%).
| Demographics | Rating | Rank | Female Unemployment |
| Immigrants | Pakistan | 66.7 /100 | #161 | Good 5.2% |
| Potawatomi | 65.9 /100 | #162 | Good 5.2% |
| Immigrants | Asia | 64.3 /100 | #163 | Good 5.2% |
| Bangladeshis | 64.3 /100 | #164 | Good 5.2% |
| Syrians | 62.8 /100 | #165 | Good 5.2% |
| Native Hawaiians | 62.7 /100 | #166 | Good 5.2% |
| Immigrants | Thailand | 62.1 /100 | #167 | Good 5.2% |
| Sri Lankans | 59.4 /100 | #168 | Average 5.2% |
| Immigrants | Chile | 59.0 /100 | #169 | Average 5.2% |
| Spanish | 55.9 /100 | #170 | Average 5.2% |
| Immigrants | Denmark | 55.0 /100 | #171 | Average 5.2% |
| Immigrants | Uganda | 50.7 /100 | #172 | Average 5.3% |
| Iranians | 50.4 /100 | #173 | Average 5.3% |
| Immigrants | Poland | 50.0 /100 | #174 | Average 5.3% |
| Immigrants | Laos | 47.5 /100 | #175 | Average 5.3% |
Demographics Similar to Okinawans by Female Unemployment
In terms of female unemployment, the demographic groups most similar to Okinawans are Immigrants from Bulgaria (4.9%, a difference of 0.080%), Austrian (4.9%, a difference of 0.11%), Greek (4.9%, a difference of 0.19%), Thai (4.9%, a difference of 0.21%), and Australian (4.9%, a difference of 0.21%).
| Demographics | Rating | Rank | Female Unemployment |
| French | 99.6 /100 | #40 | Exceptional 4.8% |
| Tongans | 99.5 /100 | #41 | Exceptional 4.8% |
| Italians | 99.5 /100 | #42 | Exceptional 4.8% |
| Eastern Europeans | 99.4 /100 | #43 | Exceptional 4.9% |
| Greeks | 99.4 /100 | #44 | Exceptional 4.9% |
| Austrians | 99.3 /100 | #45 | Exceptional 4.9% |
| Immigrants | Bulgaria | 99.3 /100 | #46 | Exceptional 4.9% |
| Okinawans | 99.3 /100 | #47 | Exceptional 4.9% |
| Thais | 99.2 /100 | #48 | Exceptional 4.9% |
| Australians | 99.2 /100 | #49 | Exceptional 4.9% |
| Immigrants | Cuba | 99.1 /100 | #50 | Exceptional 4.9% |
| Cambodians | 99.1 /100 | #51 | Exceptional 4.9% |
| Slavs | 99.1 /100 | #52 | Exceptional 4.9% |
| Whites/Caucasians | 99.0 /100 | #53 | Exceptional 4.9% |
| Immigrants | Zimbabwe | 99.0 /100 | #54 | Exceptional 4.9% |