Marshallese vs Arab Female Unemployment
COMPARE
Marshallese
Arab
Female Unemployment
Female Unemployment Comparison
Marshallese
Arabs
5.6%
FEMALE UNEMPLOYMENT
2.3/ 100
METRIC RATING
242nd/ 347
METRIC RANK
5.3%
FEMALE UNEMPLOYMENT
27.7/ 100
METRIC RATING
193rd/ 347
METRIC RANK
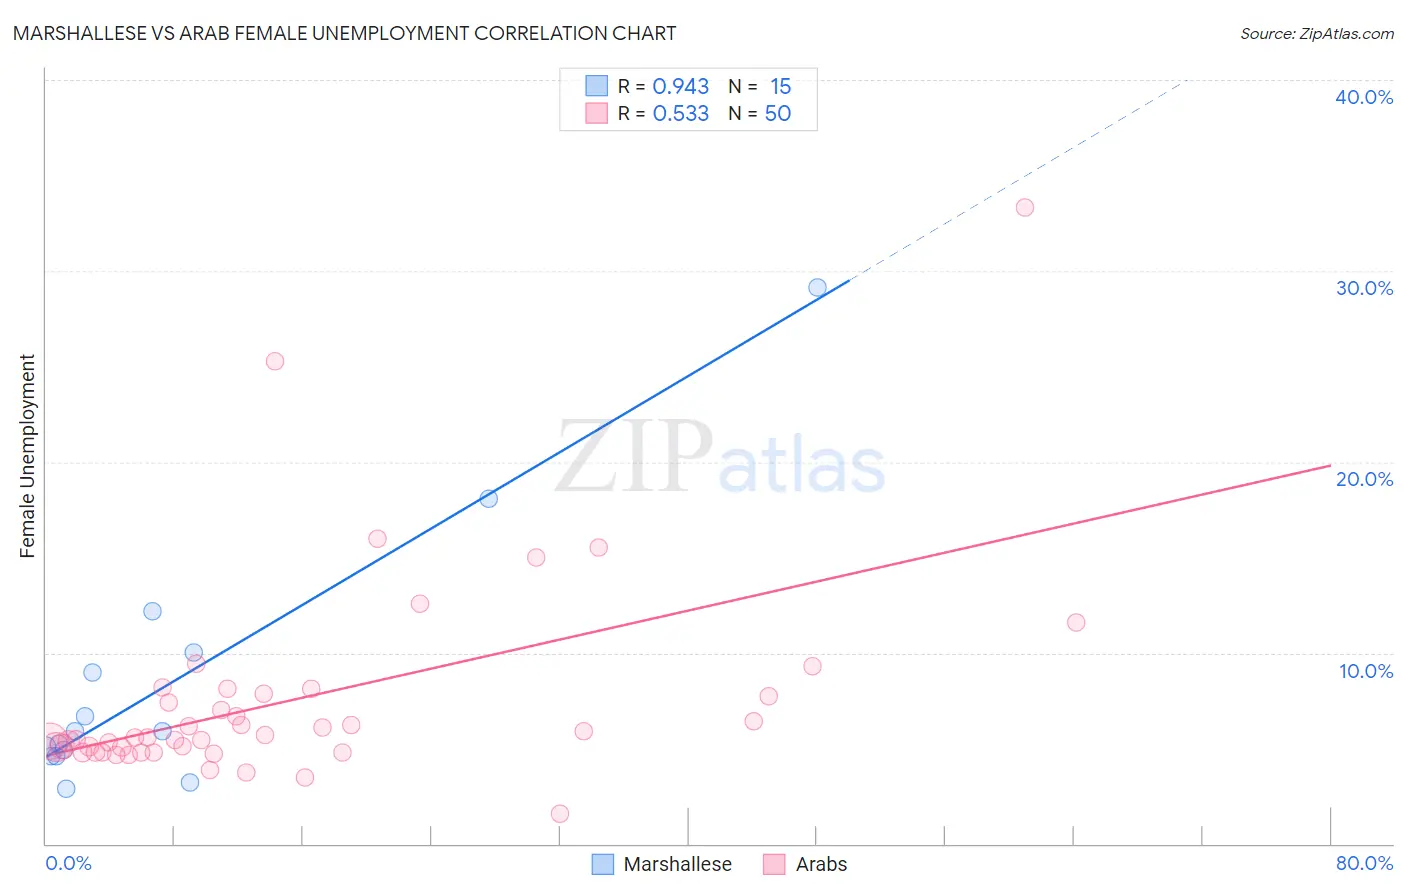
Marshallese vs Arab Female Unemployment Correlation Chart
The statistical analysis conducted on geographies consisting of 14,756,789 people shows a near-perfect positive correlation between the proportion of Marshallese and unemploymnet rate among females in the United States with a correlation coefficient (R) of 0.943 and weighted average of 5.6%. Similarly, the statistical analysis conducted on geographies consisting of 483,183,943 people shows a substantial positive correlation between the proportion of Arabs and unemploymnet rate among females in the United States with a correlation coefficient (R) of 0.533 and weighted average of 5.3%, a difference of 4.2%.
Female Unemployment Correlation Summary
| Measurement | Marshallese | Arab |
| Minimum | 2.9% | 1.6% |
| Maximum | 29.1% | 33.3% |
| Range | 26.2% | 31.7% |
| Mean | 8.5% | 7.5% |
| Median | 5.9% | 5.6% |
| Interquartile 25% (IQ1) | 4.6% | 4.8% |
| Interquartile 75% (IQ3) | 10.0% | 7.8% |
| Interquartile Range (IQR) | 5.4% | 3.0% |
| Standard Deviation (Sample) | 6.9% | 5.4% |
| Standard Deviation (Population) | 6.7% | 5.4% |
Similar Demographics by Female Unemployment
Demographics Similar to Marshallese by Female Unemployment
In terms of female unemployment, the demographic groups most similar to Marshallese are Spanish American (5.6%, a difference of 0.010%), South American Indian (5.5%, a difference of 0.32%), Immigrants from South America (5.5%, a difference of 0.37%), Aleut (5.5%, a difference of 0.40%), and Sierra Leonean (5.5%, a difference of 0.50%).
| Demographics | Rating | Rank | Female Unemployment |
| Immigrants | Iran | 3.3 /100 | #235 | Tragic 5.5% |
| Immigrants | Cambodia | 3.3 /100 | #236 | Tragic 5.5% |
| Immigrants | Panama | 3.2 /100 | #237 | Tragic 5.5% |
| Sierra Leoneans | 3.2 /100 | #238 | Tragic 5.5% |
| Aleuts | 3.0 /100 | #239 | Tragic 5.5% |
| Immigrants | South America | 2.9 /100 | #240 | Tragic 5.5% |
| South American Indians | 2.8 /100 | #241 | Tragic 5.5% |
| Marshallese | 2.3 /100 | #242 | Tragic 5.6% |
| Spanish Americans | 2.2 /100 | #243 | Tragic 5.6% |
| Immigrants | Liberia | 1.5 /100 | #244 | Tragic 5.6% |
| Guamanians/Chamorros | 1.4 /100 | #245 | Tragic 5.6% |
| Japanese | 1.2 /100 | #246 | Tragic 5.6% |
| Immigrants | Western Asia | 1.1 /100 | #247 | Tragic 5.6% |
| Cree | 1.0 /100 | #248 | Tragic 5.6% |
| Immigrants | Uzbekistan | 1.0 /100 | #249 | Tragic 5.6% |
Demographics Similar to Arabs by Female Unemployment
In terms of female unemployment, the demographic groups most similar to Arabs are Colombian (5.3%, a difference of 0.050%), Portuguese (5.3%, a difference of 0.070%), Immigrants from Colombia (5.3%, a difference of 0.11%), Spaniard (5.3%, a difference of 0.19%), and Cherokee (5.3%, a difference of 0.23%).
| Demographics | Rating | Rank | Female Unemployment |
| Immigrants | Belarus | 39.4 /100 | #186 | Fair 5.3% |
| Immigrants | Albania | 35.4 /100 | #187 | Fair 5.3% |
| Afghans | 33.9 /100 | #188 | Fair 5.3% |
| Costa Ricans | 33.8 /100 | #189 | Fair 5.3% |
| Ugandans | 31.2 /100 | #190 | Fair 5.3% |
| Cherokee | 30.8 /100 | #191 | Fair 5.3% |
| Portuguese | 28.6 /100 | #192 | Fair 5.3% |
| Arabs | 27.7 /100 | #193 | Fair 5.3% |
| Colombians | 27.0 /100 | #194 | Fair 5.3% |
| Immigrants | Colombia | 26.2 /100 | #195 | Fair 5.3% |
| Spaniards | 25.2 /100 | #196 | Fair 5.3% |
| Alsatians | 23.9 /100 | #197 | Fair 5.3% |
| Tsimshian | 23.1 /100 | #198 | Fair 5.4% |
| Hawaiians | 22.2 /100 | #199 | Fair 5.4% |
| Soviet Union | 21.7 /100 | #200 | Fair 5.4% |