Sri Lankan vs Immigrants from Turkey Female Unemployment
COMPARE
Sri Lankan
Immigrants from Turkey
Female Unemployment
Female Unemployment Comparison
Sri Lankans
Immigrants from Turkey
5.2%
FEMALE UNEMPLOYMENT
59.4/ 100
METRIC RATING
168th/ 347
METRIC RANK
5.1%
FEMALE UNEMPLOYMENT
91.0/ 100
METRIC RATING
114th/ 347
METRIC RANK
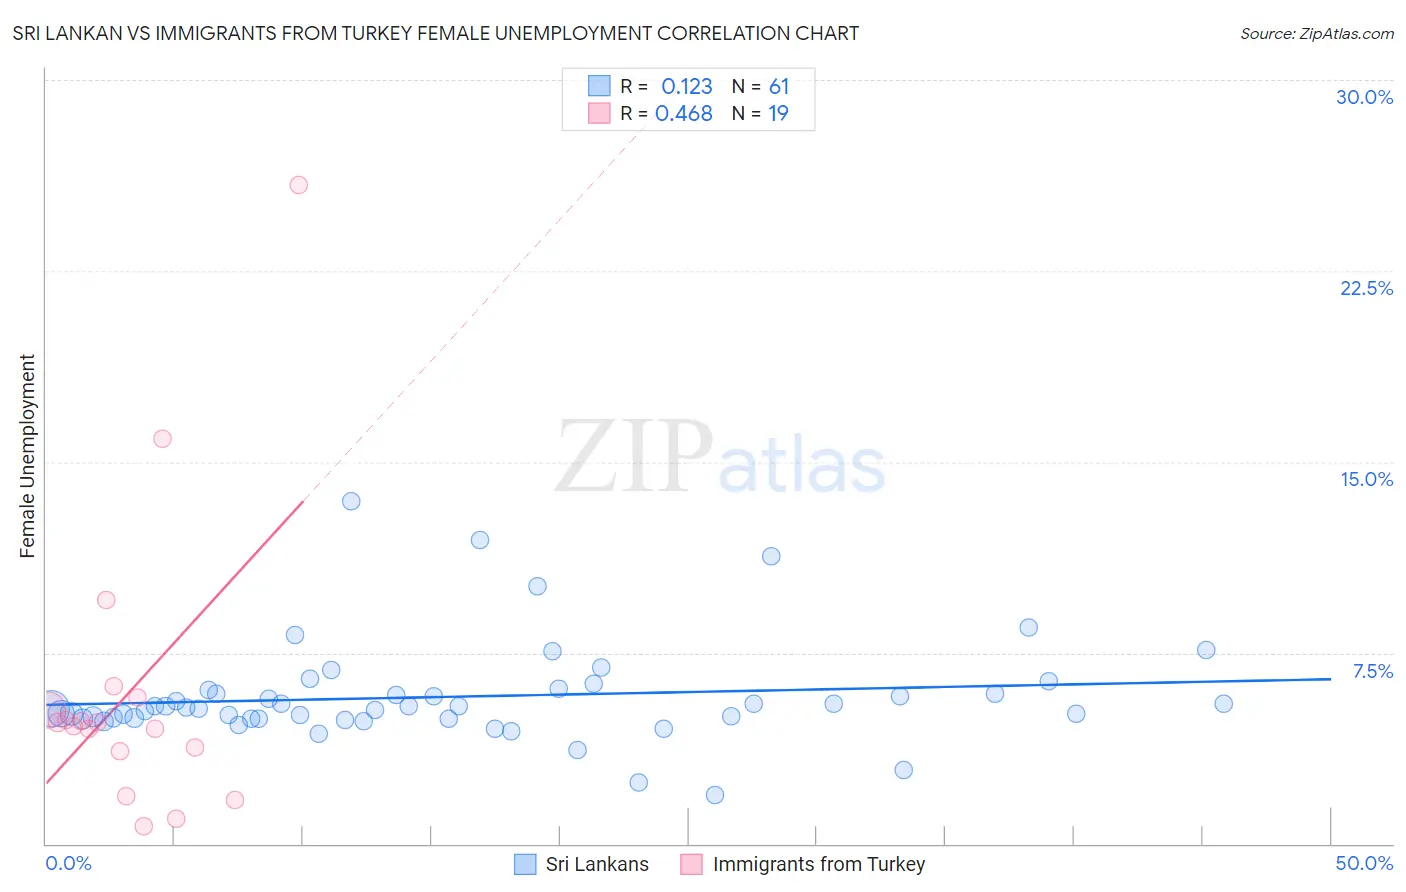
Sri Lankan vs Immigrants from Turkey Female Unemployment Correlation Chart
The statistical analysis conducted on geographies consisting of 438,500,315 people shows a poor positive correlation between the proportion of Sri Lankans and unemploymnet rate among females in the United States with a correlation coefficient (R) of 0.123 and weighted average of 5.2%. Similarly, the statistical analysis conducted on geographies consisting of 222,692,484 people shows a moderate positive correlation between the proportion of Immigrants from Turkey and unemploymnet rate among females in the United States with a correlation coefficient (R) of 0.468 and weighted average of 5.1%, a difference of 3.0%.
Female Unemployment Correlation Summary
| Measurement | Sri Lankan | Immigrants from Turkey |
| Minimum | 1.9% | 0.70% |
| Maximum | 13.5% | 25.9% |
| Range | 11.6% | 25.2% |
| Mean | 5.8% | 6.0% |
| Median | 5.3% | 4.8% |
| Interquartile 25% (IQ1) | 4.9% | 3.6% |
| Interquartile 75% (IQ3) | 6.0% | 5.7% |
| Interquartile Range (IQR) | 1.1% | 2.1% |
| Standard Deviation (Sample) | 2.0% | 5.9% |
| Standard Deviation (Population) | 1.9% | 5.7% |
Similar Demographics by Female Unemployment
Demographics Similar to Sri Lankans by Female Unemployment
In terms of female unemployment, the demographic groups most similar to Sri Lankans are Immigrants from Chile (5.2%, a difference of 0.030%), Immigrants from Thailand (5.2%, a difference of 0.17%), Syrian (5.2%, a difference of 0.21%), Native Hawaiian (5.2%, a difference of 0.21%), and Spanish (5.2%, a difference of 0.22%).
| Demographics | Rating | Rank | Female Unemployment |
| Immigrants | Pakistan | 66.7 /100 | #161 | Good 5.2% |
| Potawatomi | 65.9 /100 | #162 | Good 5.2% |
| Immigrants | Asia | 64.3 /100 | #163 | Good 5.2% |
| Bangladeshis | 64.3 /100 | #164 | Good 5.2% |
| Syrians | 62.8 /100 | #165 | Good 5.2% |
| Native Hawaiians | 62.7 /100 | #166 | Good 5.2% |
| Immigrants | Thailand | 62.1 /100 | #167 | Good 5.2% |
| Sri Lankans | 59.4 /100 | #168 | Average 5.2% |
| Immigrants | Chile | 59.0 /100 | #169 | Average 5.2% |
| Spanish | 55.9 /100 | #170 | Average 5.2% |
| Immigrants | Denmark | 55.0 /100 | #171 | Average 5.2% |
| Immigrants | Uganda | 50.7 /100 | #172 | Average 5.3% |
| Iranians | 50.4 /100 | #173 | Average 5.3% |
| Immigrants | Poland | 50.0 /100 | #174 | Average 5.3% |
| Immigrants | Laos | 47.5 /100 | #175 | Average 5.3% |
Demographics Similar to Immigrants from Turkey by Female Unemployment
In terms of female unemployment, the demographic groups most similar to Immigrants from Turkey are Lebanese (5.1%, a difference of 0.020%), Immigrants from Saudi Arabia (5.1%, a difference of 0.040%), American (5.1%, a difference of 0.10%), Jordanian (5.1%, a difference of 0.14%), and Immigrants from Croatia (5.1%, a difference of 0.20%).
| Demographics | Rating | Rank | Female Unemployment |
| Immigrants | Switzerland | 93.1 /100 | #107 | Exceptional 5.1% |
| Puget Sound Salish | 93.0 /100 | #108 | Exceptional 5.1% |
| Immigrants | Eastern Africa | 92.8 /100 | #109 | Exceptional 5.1% |
| Macedonians | 92.4 /100 | #110 | Exceptional 5.1% |
| Immigrants | Burma/Myanmar | 92.3 /100 | #111 | Exceptional 5.1% |
| Estonians | 92.1 /100 | #112 | Exceptional 5.1% |
| Immigrants | Saudi Arabia | 91.2 /100 | #113 | Exceptional 5.1% |
| Immigrants | Turkey | 91.0 /100 | #114 | Exceptional 5.1% |
| Lebanese | 91.0 /100 | #115 | Exceptional 5.1% |
| Americans | 90.5 /100 | #116 | Exceptional 5.1% |
| Jordanians | 90.3 /100 | #117 | Exceptional 5.1% |
| Immigrants | Croatia | 89.9 /100 | #118 | Excellent 5.1% |
| Immigrants | North Macedonia | 88.3 /100 | #119 | Excellent 5.1% |
| Immigrants | Romania | 88.1 /100 | #120 | Excellent 5.1% |
| Immigrants | Western Europe | 88.1 /100 | #121 | Excellent 5.1% |