Spanish vs Immigrants from Saudi Arabia Female Unemployment
COMPARE
Spanish
Immigrants from Saudi Arabia
Female Unemployment
Female Unemployment Comparison
Spanish
Immigrants from Saudi Arabia
5.2%
FEMALE UNEMPLOYMENT
55.9/ 100
METRIC RATING
170th/ 347
METRIC RANK
5.1%
FEMALE UNEMPLOYMENT
91.2/ 100
METRIC RATING
113th/ 347
METRIC RANK
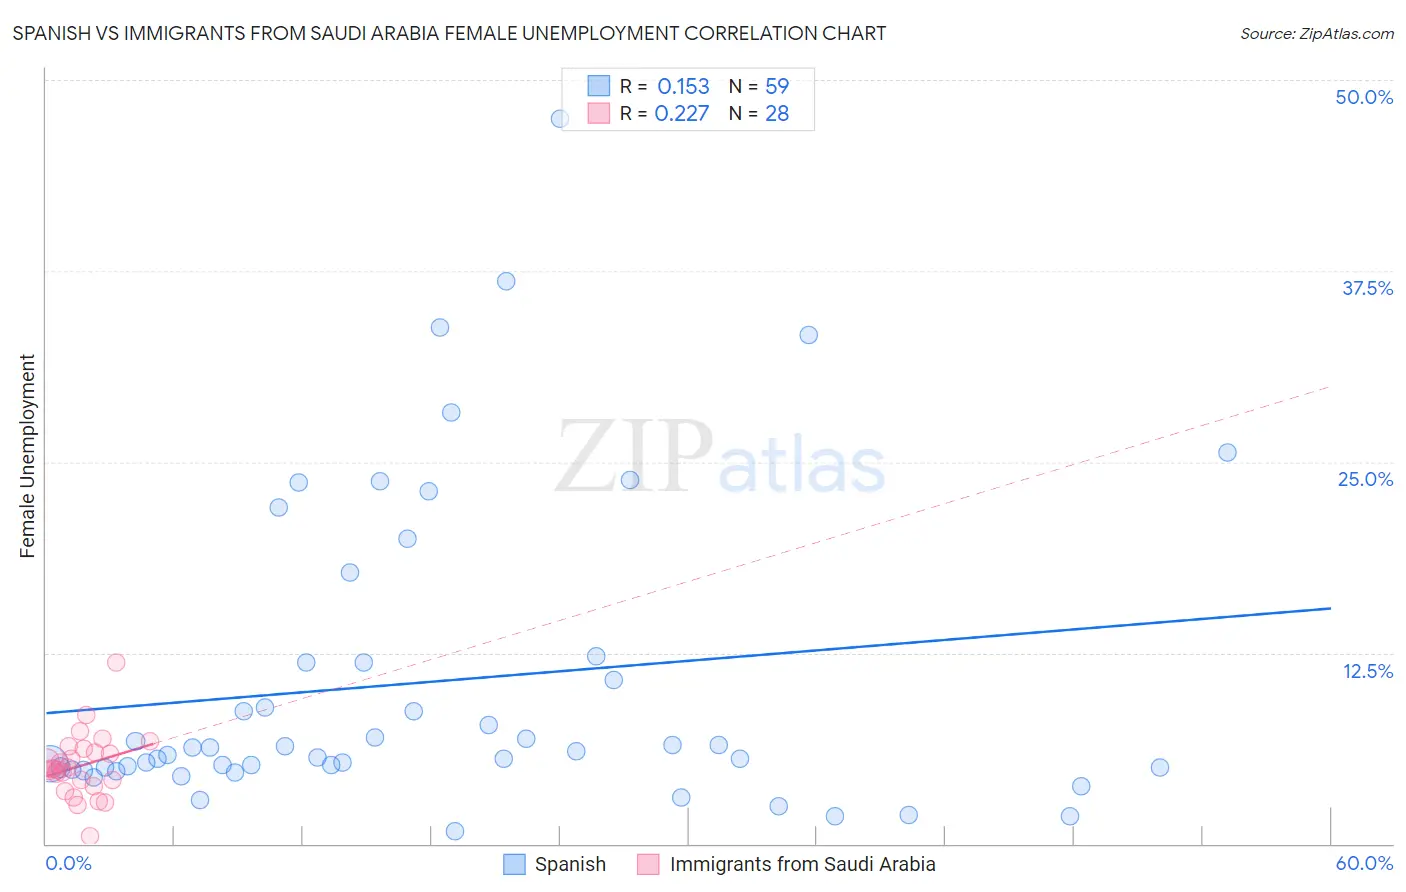
Spanish vs Immigrants from Saudi Arabia Female Unemployment Correlation Chart
The statistical analysis conducted on geographies consisting of 419,412,543 people shows a poor positive correlation between the proportion of Spanish and unemploymnet rate among females in the United States with a correlation coefficient (R) of 0.153 and weighted average of 5.2%. Similarly, the statistical analysis conducted on geographies consisting of 164,209,507 people shows a weak positive correlation between the proportion of Immigrants from Saudi Arabia and unemploymnet rate among females in the United States with a correlation coefficient (R) of 0.227 and weighted average of 5.1%, a difference of 3.3%.
Female Unemployment Correlation Summary
| Measurement | Spanish | Immigrants from Saudi Arabia |
| Minimum | 0.80% | 0.50% |
| Maximum | 47.5% | 11.9% |
| Range | 46.7% | 11.4% |
| Mean | 10.6% | 5.1% |
| Median | 6.1% | 4.9% |
| Interquartile 25% (IQ1) | 5.0% | 4.0% |
| Interquartile 75% (IQ3) | 11.9% | 6.1% |
| Interquartile Range (IQR) | 6.9% | 2.1% |
| Standard Deviation (Sample) | 10.1% | 2.1% |
| Standard Deviation (Population) | 10.0% | 2.1% |
Similar Demographics by Female Unemployment
Demographics Similar to Spanish by Female Unemployment
In terms of female unemployment, the demographic groups most similar to Spanish are Immigrants from Denmark (5.2%, a difference of 0.050%), Immigrants from Chile (5.2%, a difference of 0.19%), Sri Lankan (5.2%, a difference of 0.22%), Immigrants from Uganda (5.3%, a difference of 0.31%), and Iranian (5.3%, a difference of 0.33%).
| Demographics | Rating | Rank | Female Unemployment |
| Immigrants | Asia | 64.3 /100 | #163 | Good 5.2% |
| Bangladeshis | 64.3 /100 | #164 | Good 5.2% |
| Syrians | 62.8 /100 | #165 | Good 5.2% |
| Native Hawaiians | 62.7 /100 | #166 | Good 5.2% |
| Immigrants | Thailand | 62.1 /100 | #167 | Good 5.2% |
| Sri Lankans | 59.4 /100 | #168 | Average 5.2% |
| Immigrants | Chile | 59.0 /100 | #169 | Average 5.2% |
| Spanish | 55.9 /100 | #170 | Average 5.2% |
| Immigrants | Denmark | 55.0 /100 | #171 | Average 5.2% |
| Immigrants | Uganda | 50.7 /100 | #172 | Average 5.3% |
| Iranians | 50.4 /100 | #173 | Average 5.3% |
| Immigrants | Poland | 50.0 /100 | #174 | Average 5.3% |
| Immigrants | Laos | 47.5 /100 | #175 | Average 5.3% |
| Immigrants | Vietnam | 47.5 /100 | #176 | Average 5.3% |
| Immigrants | Morocco | 47.4 /100 | #177 | Average 5.3% |
Demographics Similar to Immigrants from Saudi Arabia by Female Unemployment
In terms of female unemployment, the demographic groups most similar to Immigrants from Saudi Arabia are Immigrants from Turkey (5.1%, a difference of 0.040%), Lebanese (5.1%, a difference of 0.050%), American (5.1%, a difference of 0.13%), Estonian (5.1%, a difference of 0.18%), and Jordanian (5.1%, a difference of 0.18%).
| Demographics | Rating | Rank | Female Unemployment |
| Paraguayans | 93.2 /100 | #106 | Exceptional 5.1% |
| Immigrants | Switzerland | 93.1 /100 | #107 | Exceptional 5.1% |
| Puget Sound Salish | 93.0 /100 | #108 | Exceptional 5.1% |
| Immigrants | Eastern Africa | 92.8 /100 | #109 | Exceptional 5.1% |
| Macedonians | 92.4 /100 | #110 | Exceptional 5.1% |
| Immigrants | Burma/Myanmar | 92.3 /100 | #111 | Exceptional 5.1% |
| Estonians | 92.1 /100 | #112 | Exceptional 5.1% |
| Immigrants | Saudi Arabia | 91.2 /100 | #113 | Exceptional 5.1% |
| Immigrants | Turkey | 91.0 /100 | #114 | Exceptional 5.1% |
| Lebanese | 91.0 /100 | #115 | Exceptional 5.1% |
| Americans | 90.5 /100 | #116 | Exceptional 5.1% |
| Jordanians | 90.3 /100 | #117 | Exceptional 5.1% |
| Immigrants | Croatia | 89.9 /100 | #118 | Excellent 5.1% |
| Immigrants | North Macedonia | 88.3 /100 | #119 | Excellent 5.1% |
| Immigrants | Romania | 88.1 /100 | #120 | Excellent 5.1% |