Spanish vs Immigrants from West Indies Unemployment Among Ages 16 to 19 years
COMPARE
Spanish
Immigrants from West Indies
Unemployment Among Ages 16 to 19 years
Unemployment Among Ages 16 to 19 years Comparison
Spanish
Immigrants from West Indies
17.3%
UNEMPLOYMENT AMONG AGES 16 TO 19 YEARS
79.3/ 100
METRIC RATING
142nd/ 347
METRIC RANK
22.2%
UNEMPLOYMENT AMONG AGES 16 TO 19 YEARS
0.0/ 100
METRIC RATING
319th/ 347
METRIC RANK
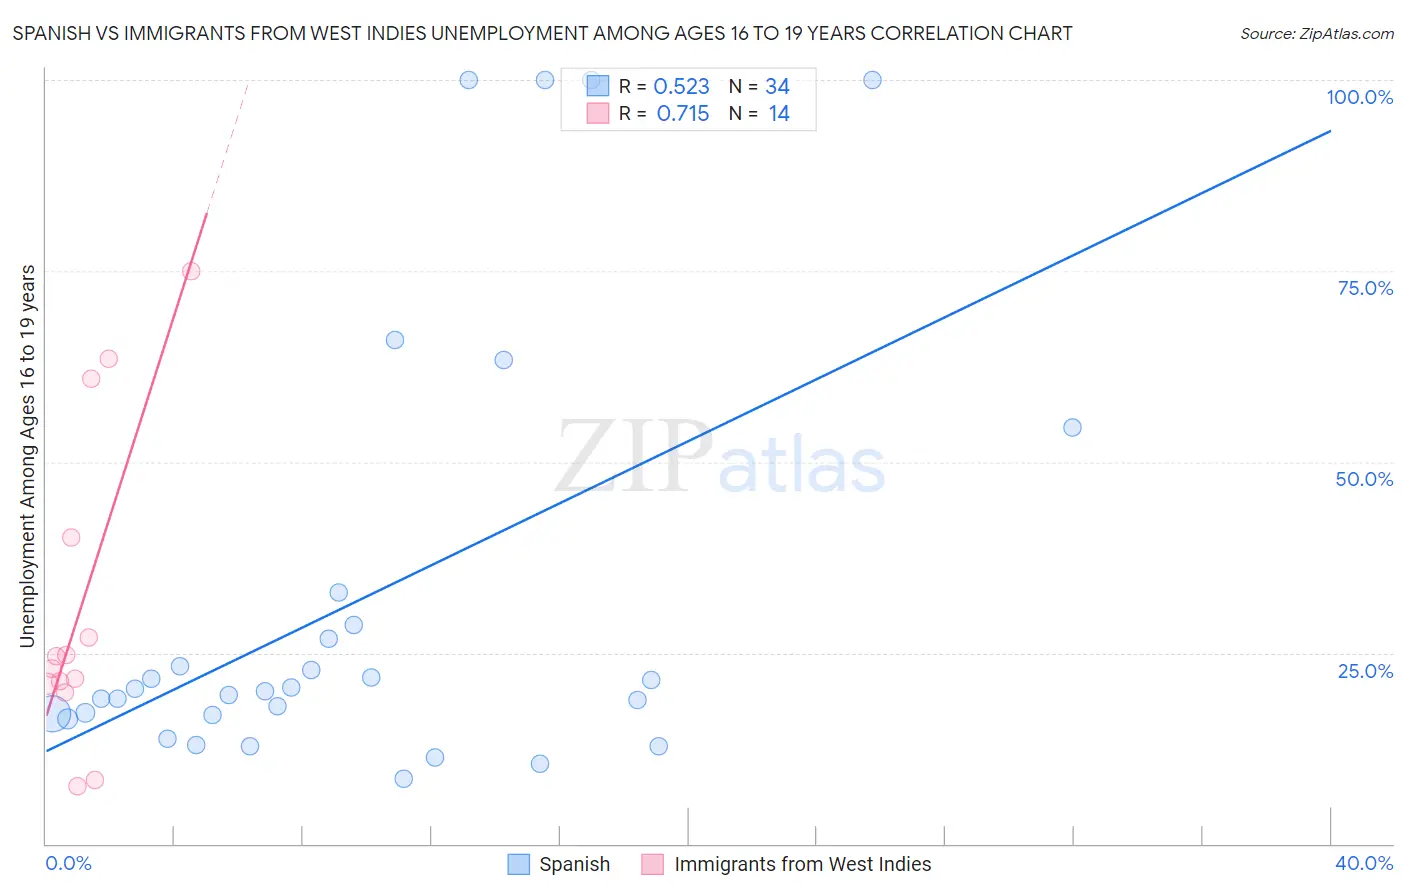
Spanish vs Immigrants from West Indies Unemployment Among Ages 16 to 19 years Correlation Chart
The statistical analysis conducted on geographies consisting of 398,416,899 people shows a substantial positive correlation between the proportion of Spanish and unemployment rate among population between the ages 16 and 19 in the United States with a correlation coefficient (R) of 0.523 and weighted average of 17.3%. Similarly, the statistical analysis conducted on geographies consisting of 71,880,960 people shows a strong positive correlation between the proportion of Immigrants from West Indies and unemployment rate among population between the ages 16 and 19 in the United States with a correlation coefficient (R) of 0.715 and weighted average of 22.2%, a difference of 28.5%.
Unemployment Among Ages 16 to 19 years Correlation Summary
| Measurement | Spanish | Immigrants from West Indies |
| Minimum | 8.4% | 7.6% |
| Maximum | 100.0% | 75.0% |
| Range | 91.6% | 67.4% |
| Mean | 32.0% | 31.3% |
| Median | 20.1% | 23.7% |
| Interquartile 25% (IQ1) | 16.9% | 21.0% |
| Interquartile 75% (IQ3) | 28.6% | 40.1% |
| Interquartile Range (IQR) | 11.7% | 19.2% |
| Standard Deviation (Sample) | 28.5% | 20.8% |
| Standard Deviation (Population) | 28.0% | 20.0% |
Similar Demographics by Unemployment Among Ages 16 to 19 years
Demographics Similar to Spanish by Unemployment Among Ages 16 to 19 years
In terms of unemployment among ages 16 to 19 years, the demographic groups most similar to Spanish are Immigrants from Egypt (17.3%, a difference of 0.010%), Immigrants from England (17.3%, a difference of 0.020%), Basque (17.3%, a difference of 0.11%), Immigrants from Croatia (17.3%, a difference of 0.12%), and Indian (Asian) (17.3%, a difference of 0.12%).
| Demographics | Rating | Rank | Unemployment Among Ages 16 to 19 years |
| Samoans | 83.7 /100 | #135 | Excellent 17.2% |
| Immigrants | Oceania | 83.1 /100 | #136 | Excellent 17.2% |
| Immigrants | Malaysia | 82.8 /100 | #137 | Excellent 17.2% |
| Bolivians | 81.9 /100 | #138 | Excellent 17.3% |
| Immigrants | Eritrea | 81.1 /100 | #139 | Excellent 17.3% |
| Immigrants | Croatia | 80.8 /100 | #140 | Excellent 17.3% |
| Basques | 80.7 /100 | #141 | Excellent 17.3% |
| Spanish | 79.3 /100 | #142 | Good 17.3% |
| Immigrants | Egypt | 79.1 /100 | #143 | Good 17.3% |
| Immigrants | England | 78.9 /100 | #144 | Good 17.3% |
| Indians (Asian) | 77.6 /100 | #145 | Good 17.3% |
| Turks | 77.1 /100 | #146 | Good 17.3% |
| Tsimshian | 76.0 /100 | #147 | Good 17.3% |
| Romanians | 74.9 /100 | #148 | Good 17.3% |
| Immigrants | Eastern Asia | 73.8 /100 | #149 | Good 17.4% |
Demographics Similar to Immigrants from West Indies by Unemployment Among Ages 16 to 19 years
In terms of unemployment among ages 16 to 19 years, the demographic groups most similar to Immigrants from West Indies are Immigrants from Jamaica (22.2%, a difference of 0.16%), Cheyenne (22.3%, a difference of 0.23%), Immigrants from Belize (22.2%, a difference of 0.31%), Tohono O'odham (22.1%, a difference of 0.76%), and West Indian (22.4%, a difference of 0.92%).
| Demographics | Rating | Rank | Unemployment Among Ages 16 to 19 years |
| Houma | 0.0 /100 | #312 | Tragic 21.6% |
| Jamaicans | 0.0 /100 | #313 | Tragic 21.7% |
| Alaska Natives | 0.0 /100 | #314 | Tragic 21.8% |
| Immigrants | Dominica | 0.0 /100 | #315 | Tragic 21.9% |
| Tohono O'odham | 0.0 /100 | #316 | Tragic 22.1% |
| Immigrants | Belize | 0.0 /100 | #317 | Tragic 22.2% |
| Immigrants | Jamaica | 0.0 /100 | #318 | Tragic 22.2% |
| Immigrants | West Indies | 0.0 /100 | #319 | Tragic 22.2% |
| Cheyenne | 0.0 /100 | #320 | Tragic 22.3% |
| West Indians | 0.0 /100 | #321 | Tragic 22.4% |
| Barbadians | 0.0 /100 | #322 | Tragic 22.5% |
| Yakama | 0.0 /100 | #323 | Tragic 22.5% |
| Immigrants | Armenia | 0.0 /100 | #324 | Tragic 22.6% |
| Trinidadians and Tobagonians | 0.0 /100 | #325 | Tragic 22.6% |
| Immigrants | Trinidad and Tobago | 0.0 /100 | #326 | Tragic 23.1% |